Exploding Topics is an app in the Semrush App Center that allows you to track and analyze online trends and markets to spot growth opportunities early.
It’s designed to deliver insights that empower your team and enhance your business strategy when it comes to getting ahead of the competition. It has a database of 1.1M+ trends that covers a range of industries, channels and growth signals and instantly alerts you when hot topics emerge.
The Benefits of Exploding Topics
Exploding Topics gives you a headstart on your competition by allowing you to see trends before anyone else—it tracks every topic on the Internet to help you spot them before your rivals.
You can also use it to discover challengers to your business, from emerging startups to individual products, thanks to the detection of early growth signals and long-term growth potential.
Exploding Topics also pinpoints under-the-radar markets, from SaaS to DTC, to arm you with insights into what’s about to hit the mainstream.
Pricing and Limits
Exploding Topics is available on three plans, ranging from Entrepreneur at $39/month through Investor at $99/month to Business at $249/month.
- Entrepreneur
- Trends Database
- 100 Tracked Trends
- 10 Trend Analyses
- Trending Products
- Meta Trends
- Investor
- Trends Database
- 500 Tracked Trends
- 100 Trend Analyses
- Trending Startups
- Trending Products
- Meta Trends
- Trend Forecasting
- CSV Export
- Business
- Trends Database
- 2,000 Tracked Trends
- 500 Trend Analyses
- Trending Startups
- Trending Products
- Meta Trends
- Trend Forecasting
- Trend Reports
- API Access
You can try the app for free on a 7-day trial, after which you’ll be subscribed to one of the above plans unless you cancel.
What’s Included in Exploding Topics?
Trend Tracking
This is where you’ll find all the trends you choose to track throughout the app, such as in the Trends Database or Trending Startups sections. You can add your first trend by clicking the ‘Track Topic’ button and adding it to a project—you can create your first project this way, too.

You can create as many projects as you like and add as many topics to an individual project as you like, though your total number of topics used across the whole app will be limited according to your subscription level.
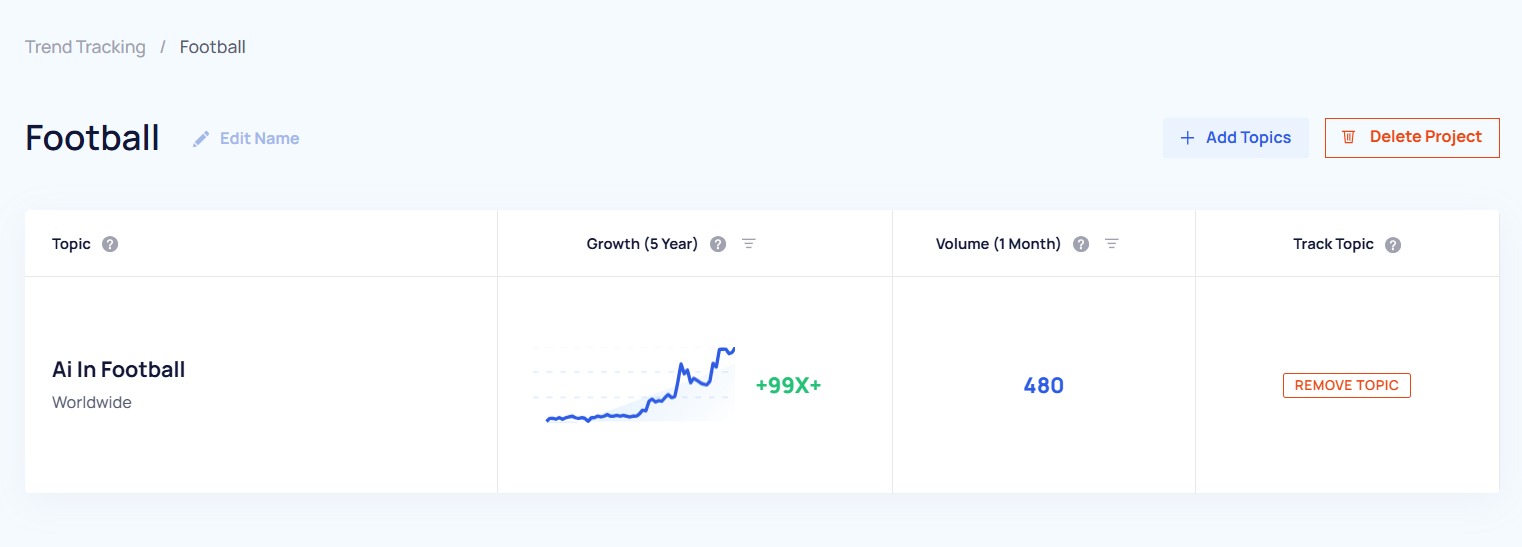
Head back to this section via the left-hand navigation menu at any time to view your saved trend reports, which will be categorized according to your projects.

You can click ‘View Project’ to see all the tracked trends within it, add topics to it, edit its name and delete it permanently if you wish.
Trends Database
The Trends Database is a comprehensive and ever-expanding database of 1.1M+ under-the-radar markets, products and investment opportunities. It’s populated by an advanced algorithm that monitors millions of unstructured data points to spot trends early, combining data analytics, machine learning and human analysis to plug into your strategic research.
The database is updated daily to provide insights into emerging trends and growth opportunities for businesses.
You can dive into the Trends Database using the search bar at the top of the screen or by navigating to it via the menu. To use the search bar, start typing your keyword and the app will filter its trend results accordingly. Click on a trend of your choice to investigate the data.

To use the menu to filter your options, simply hover over a category and select your subcategory to investigate the active topics within it.

Clicking ‘Robotics’ in the example above will present you with a series of topics related to that term to start analyzing—you can use the menu at the top-left to start filtering your results.

You can sort by:
- Growth: The percentage increase in searches within the time period
- Trend Line: The average growth as determined by the ‘best fit’ trend line
- Discovered Date: The trends that the trend detection algorithms have most recently found
- Highest Volume: The trends with the most absolute global Google searches per month
- Lowest Volume: The trends with the least absolute global Google searches per month
You can choose a timeframe of between 3 months and 15 years to show the relevant time series chart data for Google search volume within that period. You can also see a Future Forecast if you are on an Investor or a Business plan, which will be a prediction of the next 12 months of activity around a trend based on a deep machine-learning model trained on millions of data points.
You can filter Growth levels by all or:
- Regular: Topics that show consistent growth detected over the measured period
- Peaked: Topics that demonstrate a downward trend or a peak of activity that has already passed
- Exploding: Topics that demonstrate a rapid upward trend by way of a sharp increase in activity within the measured period
You can also filter your results by Brand and Non-Brand to show topics related to businesses within your chosen category.
Each topic tile will depict the data according to your filters along with an AI-generated summary at the bottom—you’ll also find a green button for you to ‘Track Topic’ at the bottom-right of each tile.
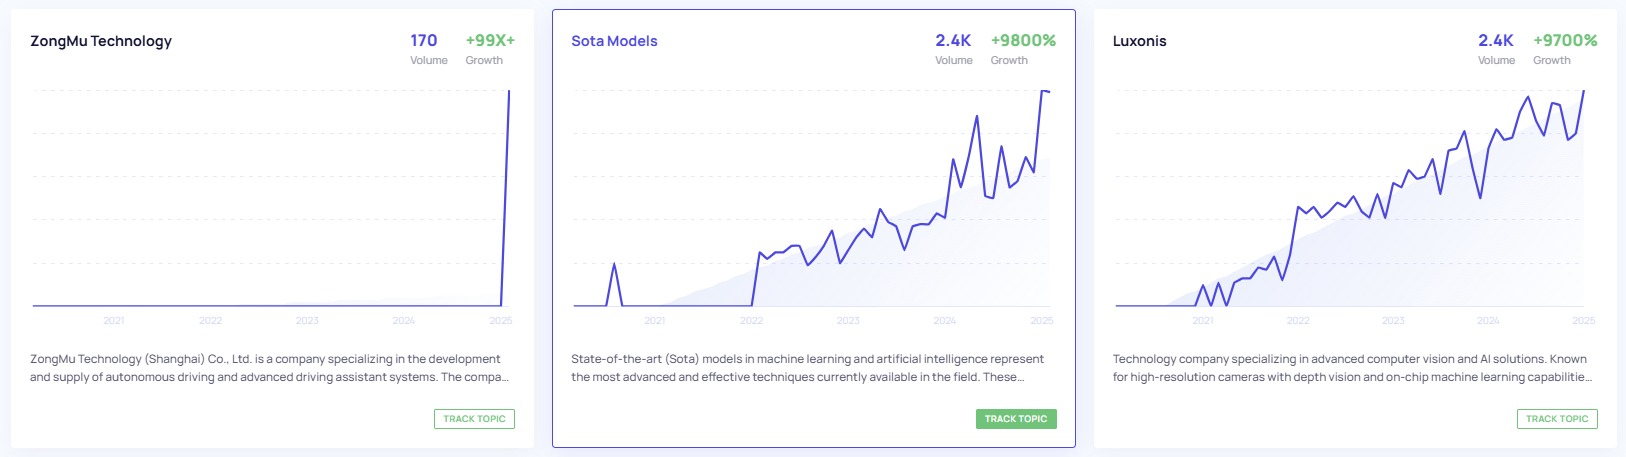
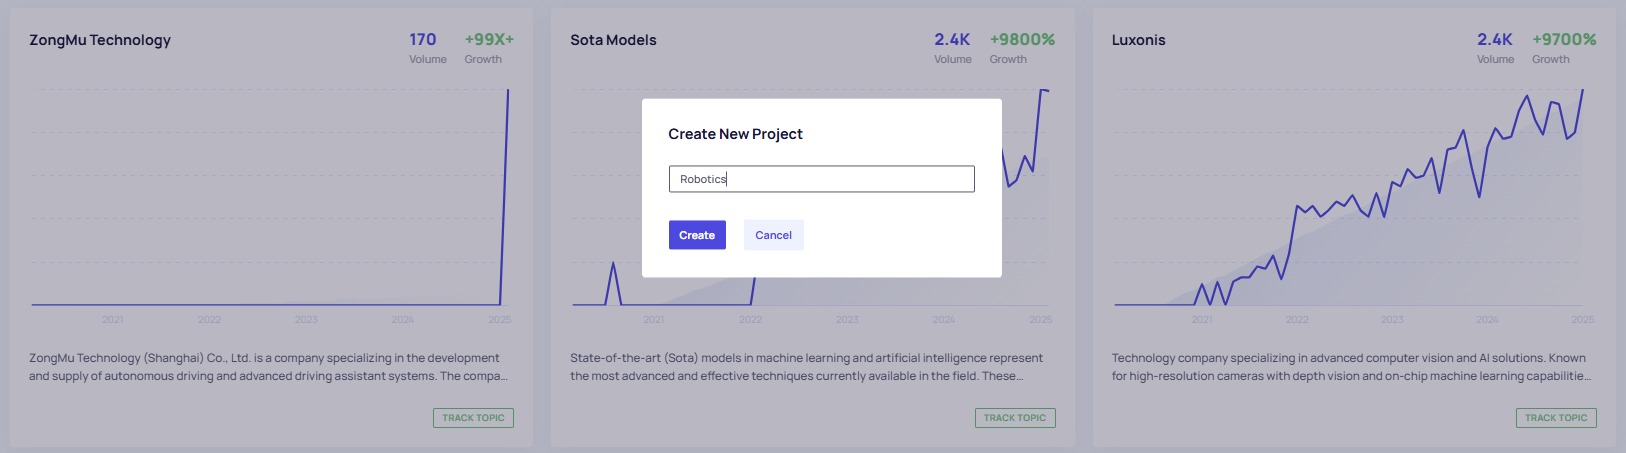
You can add them to existing projects or create a new one from there—every new project and topic tracked therein will appear in the Trend Tracking section.
Trend Analysis
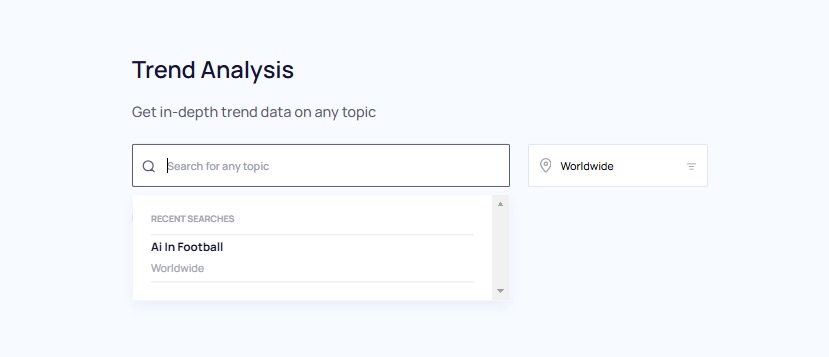
The Trend Analysis section is where you can take a deep dive into the data on any trend, including growth, search performance and channel-based insights.
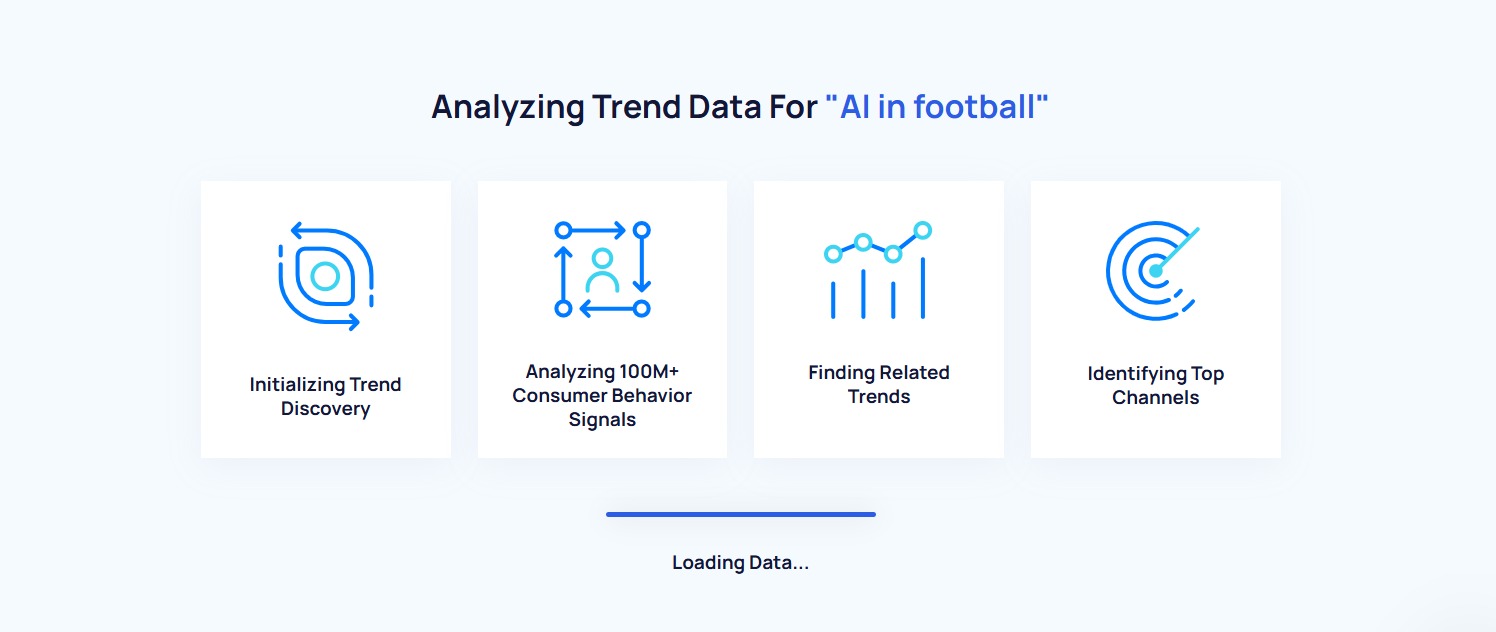
When you first search for a topic, the app will scour millions of data points to generate a report based on your keyword. If the trend doesn’t yet exist in the Trends Database, it will need to be created from scratch, which can take 1-2 minutes.
Your recent searches will appear as a dropdown menu on the search bar and you can choose your target territory using the location-based dropdown menu on the right. All topics tracked in the database and accessed via Trend Analysis, Trending Products or Trending Startups are global by default—you can choose to track by specific locales instead and find your reports in the associated project in the Trend Tracking section.
Each topic report generated via the Trends Analysis section features a graph of recent search volume and a growth % figure that shows the change in said volume over time. It will be green if the topic has trended upwards and red if it has trended downwards, which will also be visualized in the graph. You can hover over any part of the line graph to reveal the search volume at a specific point in your chosen time period—you can change the timeframe by using the dropdown menu to the left of the volume and growth figures.
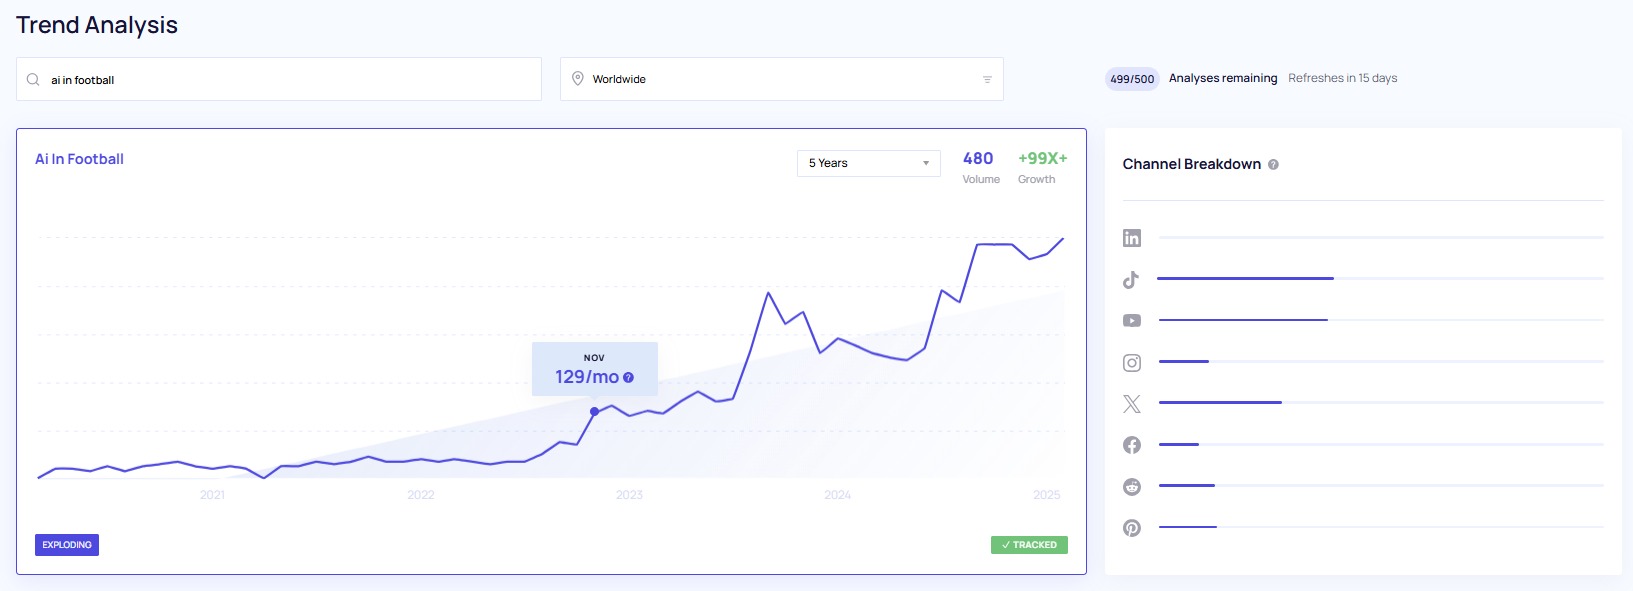
This section will contain a Channel Breakdown as a table on the right, too, which shows the topic’s activity on various social channels, including TikTok, YouTube, LinkedIn, Instagram, X, Facebook, Reddit and Pinterest. This will tell you which channels are the most and least popular amongst people searching for and engaging with a topic.
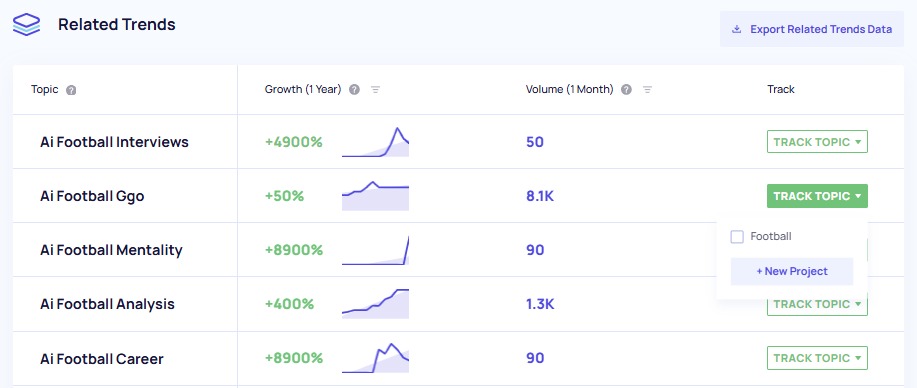
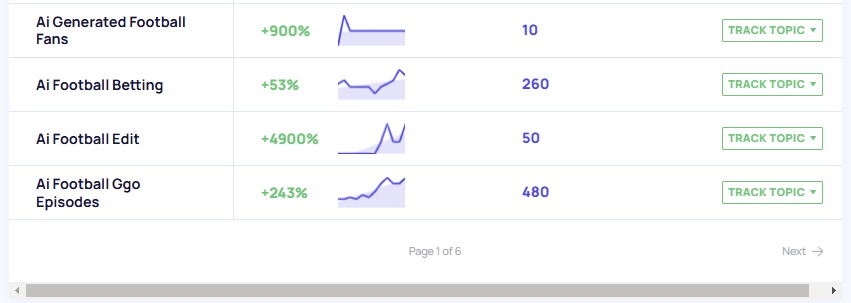
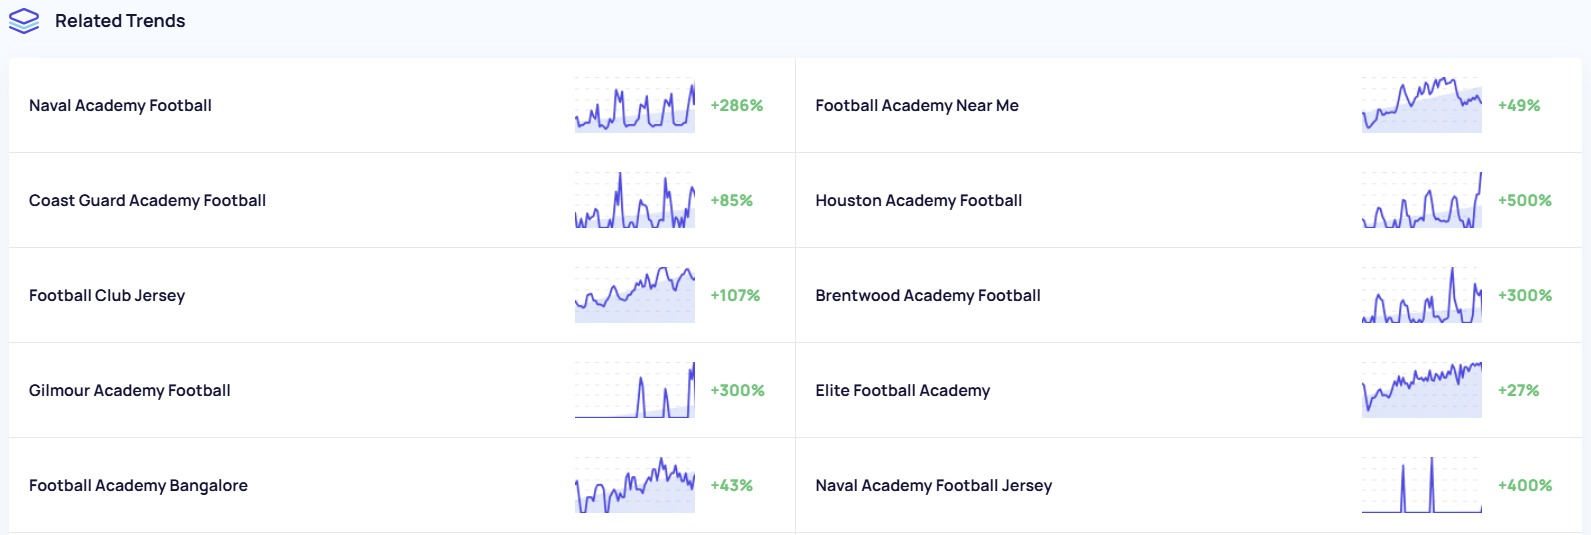
Beneath that, you should see a list of Related Trends, which are keyword trends that people often use within the category of the main topic. Below is an example of the subtopics connected to the main search term ‘AI in football’—you can see and sort by growth (1 year) and search volume (1 month) here and also add the topic to your tracked trends within a project using the green button on the right.
If it’s a particularly popular trend, you may get multiple pages of results—scroll down to the bottom of the list and click ‘Next’ to scan through more subtopics.
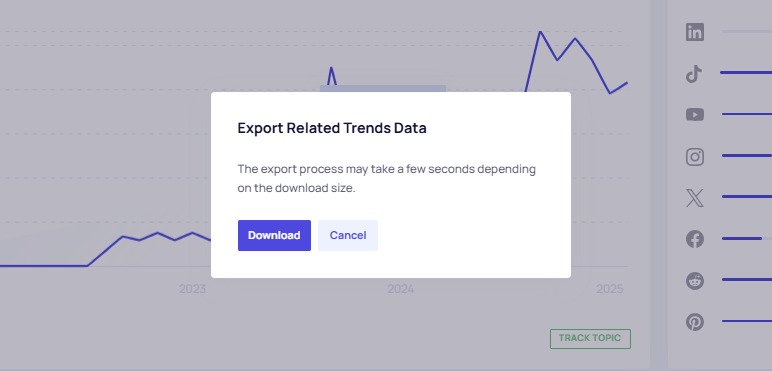
If you’re on an Investor or a Business plan, you can download the Related Trends data using the button at the top-right of the table—the download time may vary depending on the volume of data.
When you access the topic data via the Trend Tracking section for a global trend, you’ll also see an About The Topic section and a breakdown of the Key Indicators. If you’re looking at trends in a specific region, this section will be called Trend Geography.
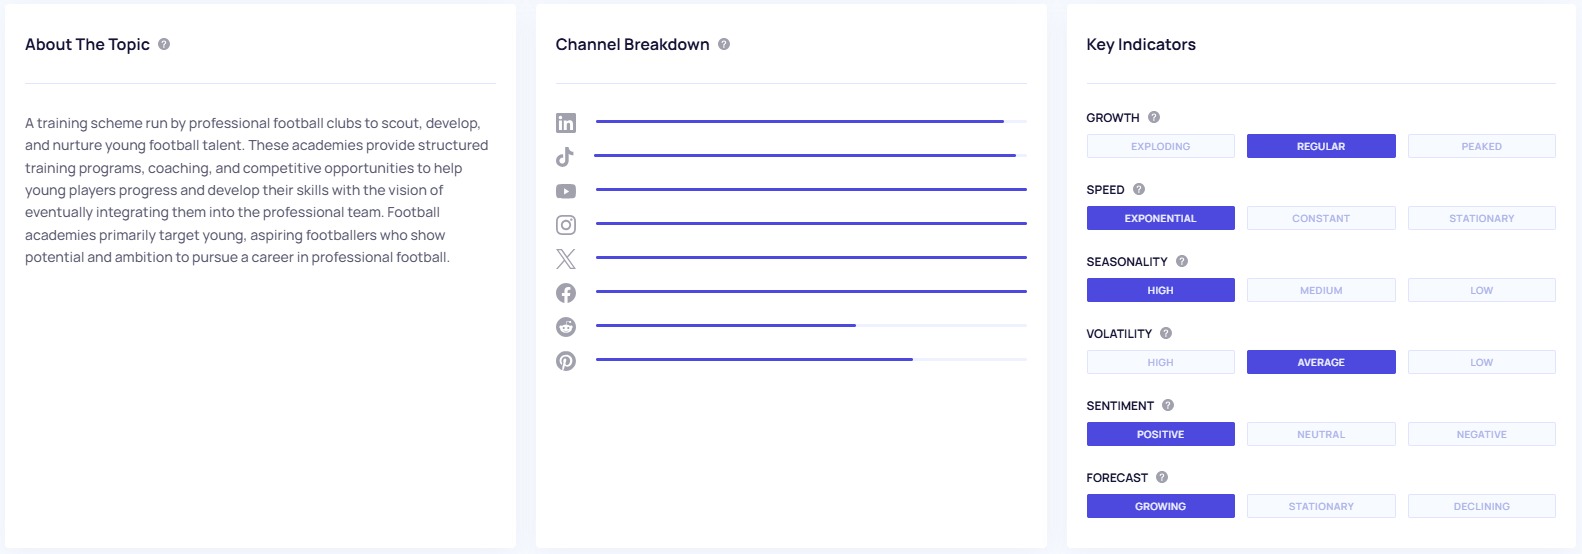
The About The Topic or Trend Geography section provides a summary of the topic that’s generated by AI based on information available across the web.
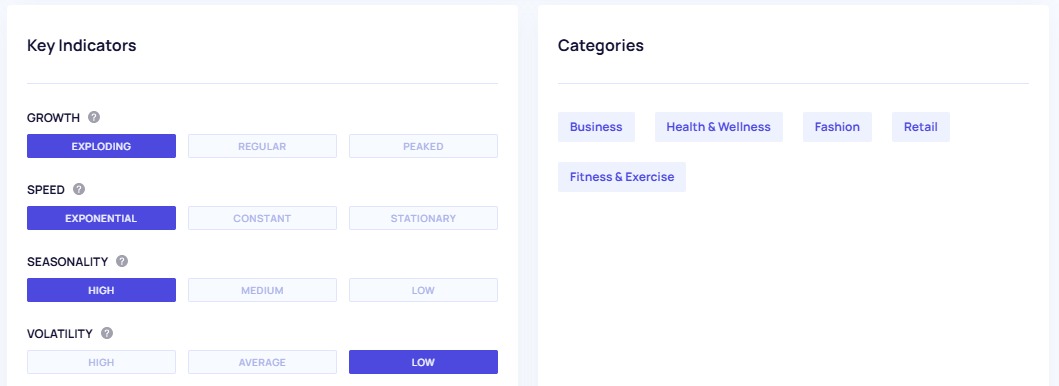
The Key Indicators are a set of classifications applied to each topic based on the app’s machine-learning models. They include:
- Growth: This indicator measures the trend's growth over time, taking into account its growth rate and trend line
- Exploding: Rapid upward trend, indicating a sharp increase over the time period measured
- Regular: Consistent growth detected over the period measured
- Peaked: Indicates a downward trend, or one that has already peaked, over the period measured
- Speed: This indicator evaluates the speed of growth focusing on its exponential behavior over time
- Exponential: Trend is growing at an exponential rate
- Constant: Trend is on an upward trajectory, but showing a constant rate of growth
- Stationary: Trend isn't seeing any rate of growth or decline; it remains flat over the measured period
- Seasonality: This indicator measures the recurring patterns that occur periodically over time, taking into account its overall cyclicality (wave-like pattern)
- High: Consistent recurring patterns indicating a significant increase or decrease during certain periods
- Medium: Recurring patterns with few sudden upward or downward trends detected during certain periods
- Low: Lack of recurring patterns, indicating little to no variation during different periods
- Volatility: This indicator measures the degree of variation or change over a certain period of time, taking into account its overall instability or unpredictability
- High: Consistent large and significant fluctuations, indicating a significant variation over the period measured
- Average: Fluctuations with few sudden upward or downward shifts detected over the period measured
- Low: Small or no fluctuations, indicating little or gradual change over the period measured
- Sentiment: This indicator measures the overall feeling or attitude towards a trend, taking into account its overall positivity or negativity
- Positive: Consistent positive consumer feelings or attitudes, indicating a favorable view over the period measured. This implies the trend has a high degree of positive sentiment.
- Neutral: Balanced consumer feelings or attitudes with few sudden shifts towards positivity or negativity detected over the period measured. This suggests the trend has a neutral level of sentiment.
- Negative: Consistent negative consumer feelings or attitudes. This suggests the trend has a high degree of negative sentiment.
- Forecast: This indicator predicts the direction of a trend over the next 12 months, using a machine-learning model trained on millions of data points
- Growing: Prediction of an upward trend, indicating an expected increase over the forecast period. This suggests the trend is expected to grow.
- Stationary: Consistent prediction of little to no change with few sudden shifts expected over the period forecasted. This suggests the trend is expected to remain flat or constant.
- Declining: Prediction of a downward trend, indicating an expected decrease over the period forecasted. This suggests the trend is expected to decline.
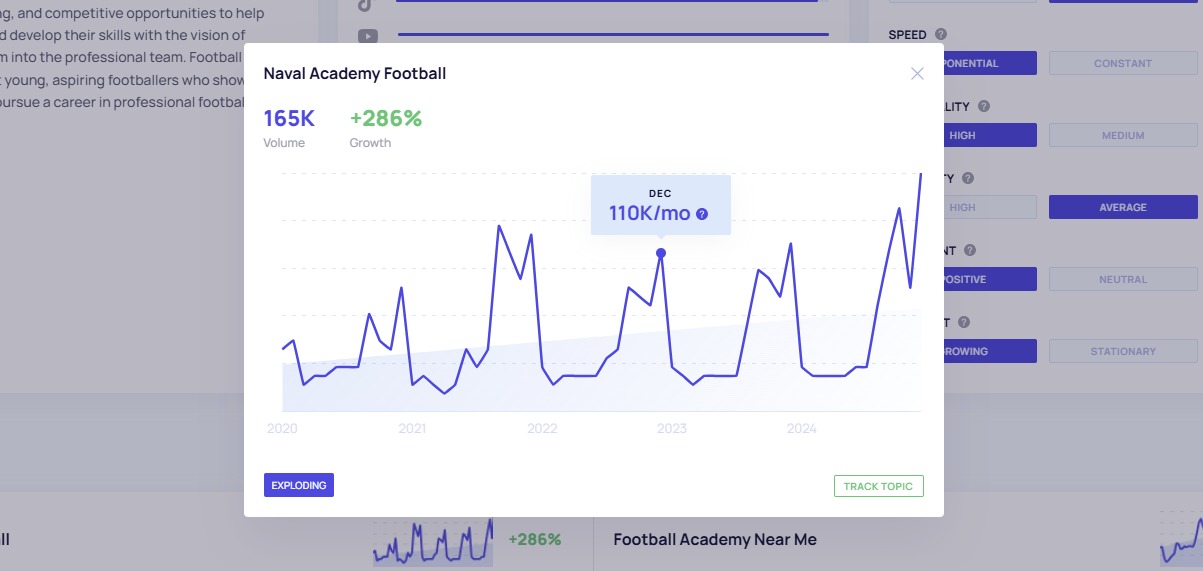
You’ll also see more Related Trends beneath that, where you can preview a graph and growth figure and click through for a pop-up with more information.
You’ll get an indication of the status of the trend at the bottom-left and the ability to add it to a project at the bottom-right of this pop-up graph.
Within some trend analyses, you may see a Forecast depicted on the graph as a dotted line if you are on an Investor or a Business plan, which you can turn on and off via the switch at the top-right.

Trending Startups
The Trending Startups section available on the Investor and Business plans gives you a list of new and growing businesses across the world based on subsets of data from the Trends Database.
You can filter and sort the results using the menu at the top and the column headers, e.g. selecting a category related to your business or sorting by funding levels if the data points are public (if they are not, this cell will say ‘Undisclosed’).
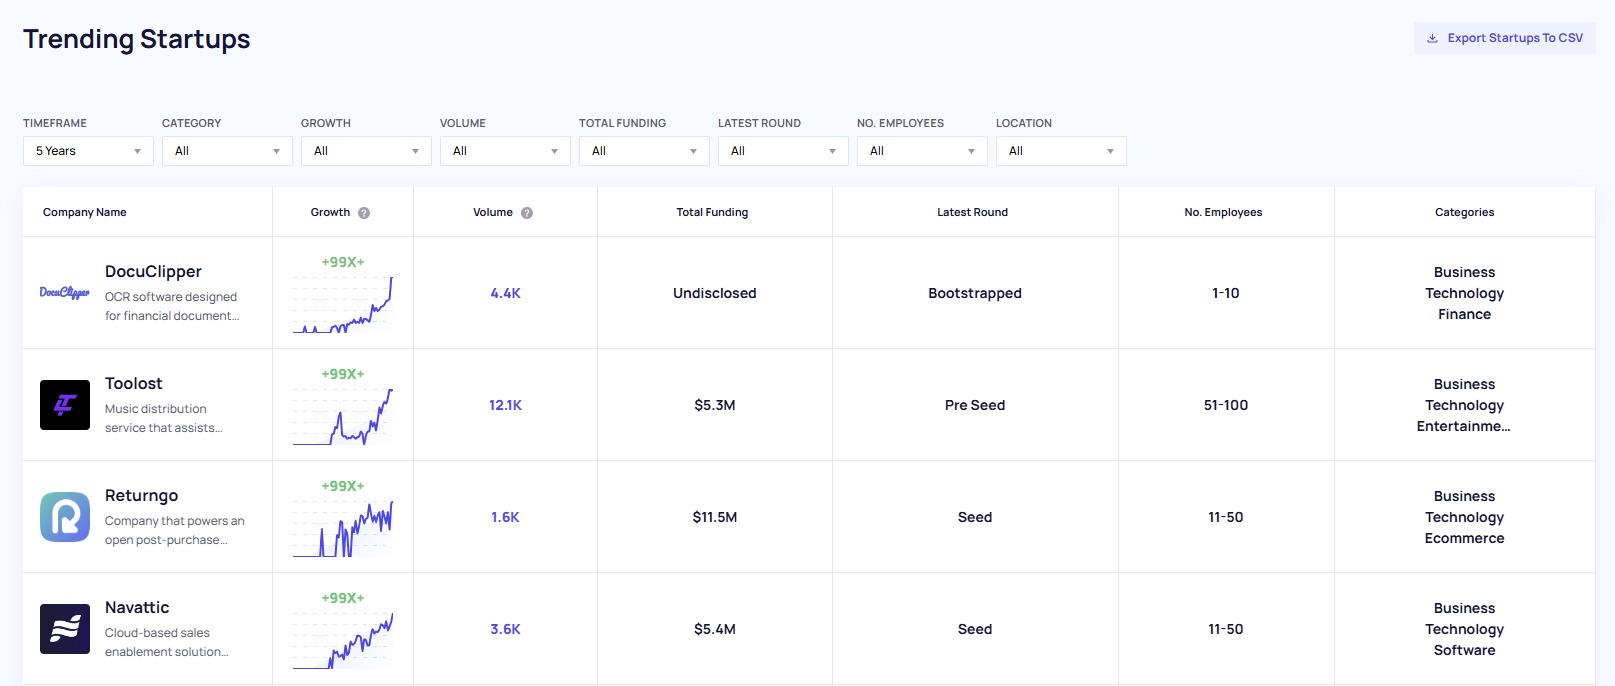
You can click on any of the startups to find out more, including Volume, Growth, Channel Breakdown and Key Indicators, as described above. You’ll also see a summary at the top-left, which is gleaned from information available across the web.

On the right beside Key Indicators, you’ll get a list of the Categories within which the selected startup operates—you can click any of these to delve into the details of other startups within each category.
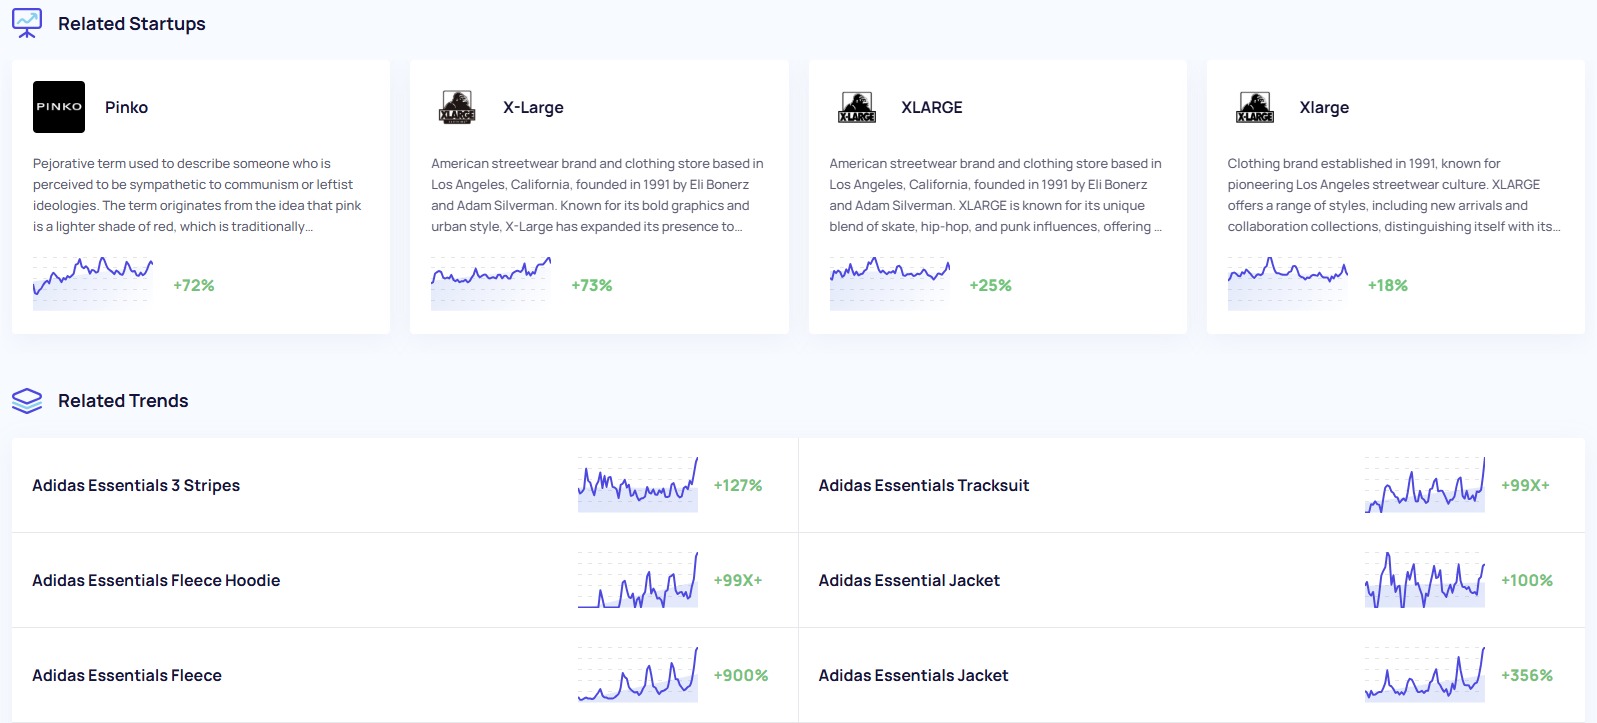
Related Startups and Related Trends data can be found further down the page, which are matched to the topic you’re researching by keyword, description and category. You can also investigate these further simply by clicking on the boxes.
Trending Products
The Trending Products section works in a similar way to the Trending Startups section outlined above, only with different categories by which you can filter or sort the data. It is an analysis of trending items within Amazon’s Marketplace.
For example, you can sort pet products by Best Sellers Rank (BSR) by clicking the Avg. BSR column header at the top. You can also get insights into average revenue, price, sales and reviews across the Marketplace in this table.
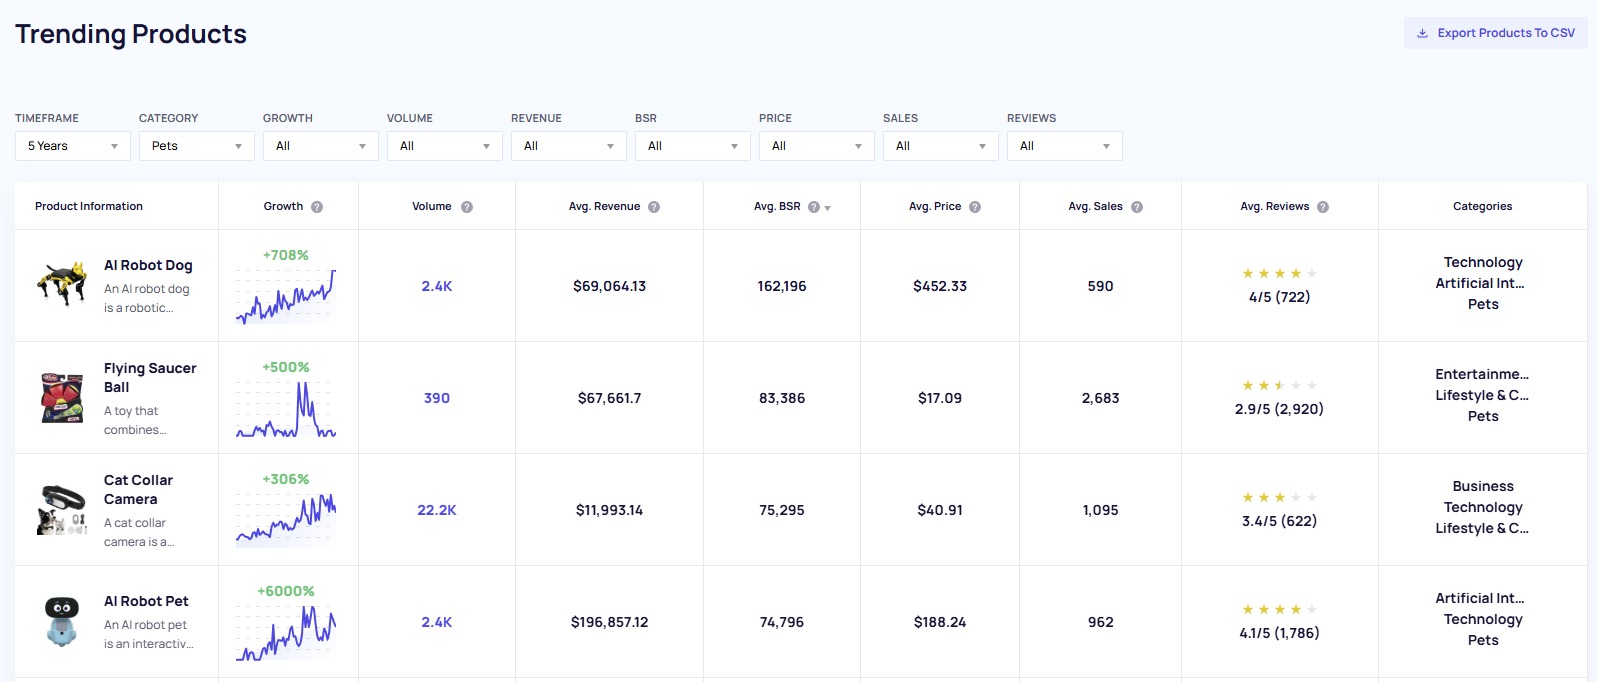
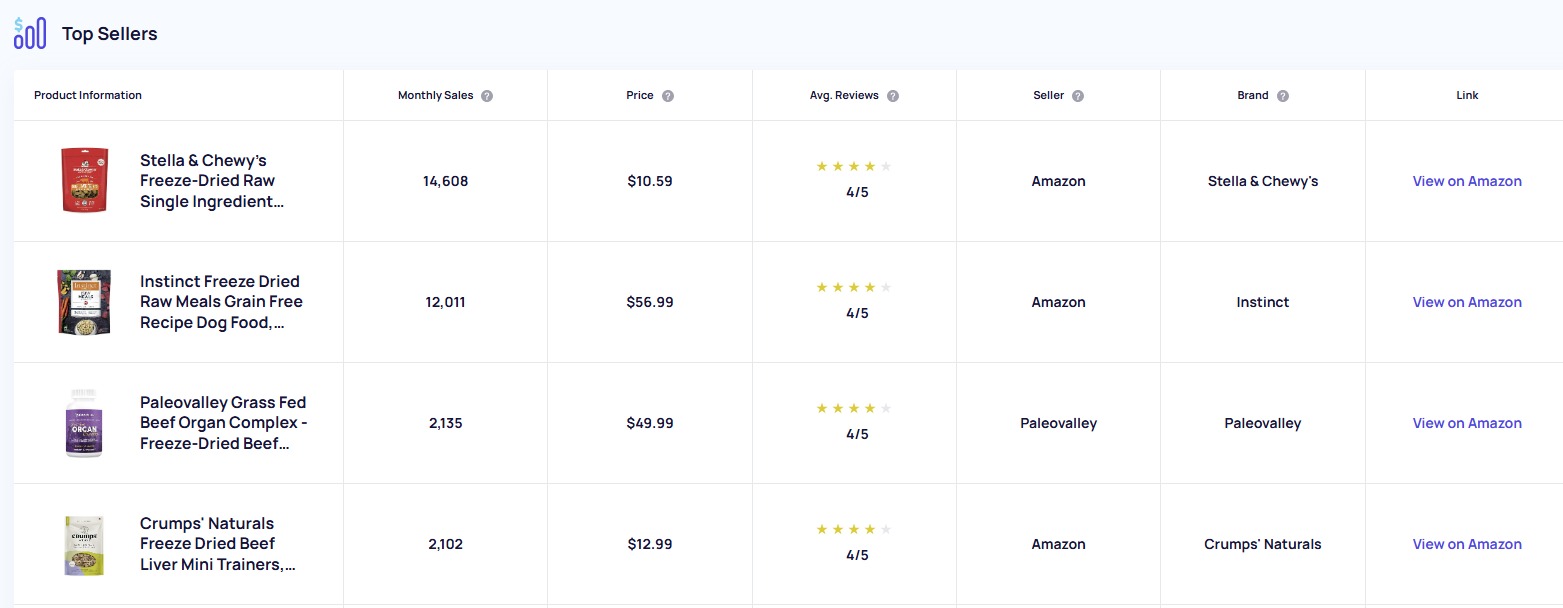
Click on any of the products to view a more in-depth dataset, including Volume, Growth, Channel Breakdown, Key Indicators, plus a breakdown of the Top Sellers on Amazon.
Meta Trends
Meta Trends reflect a broader wave of many micro trends within any given industry. For instance, you might see micro trends like ‘lofi music’ and ‘green noise’ within the macro trend of ‘Sleep Tech,’ as per the example below. On the outer ring, you can also see other topics related to macro trend in question, such as ‘bamboo pajamas’ in this example. You can click on any of the topics to reveal a volume and growth graph on this page.
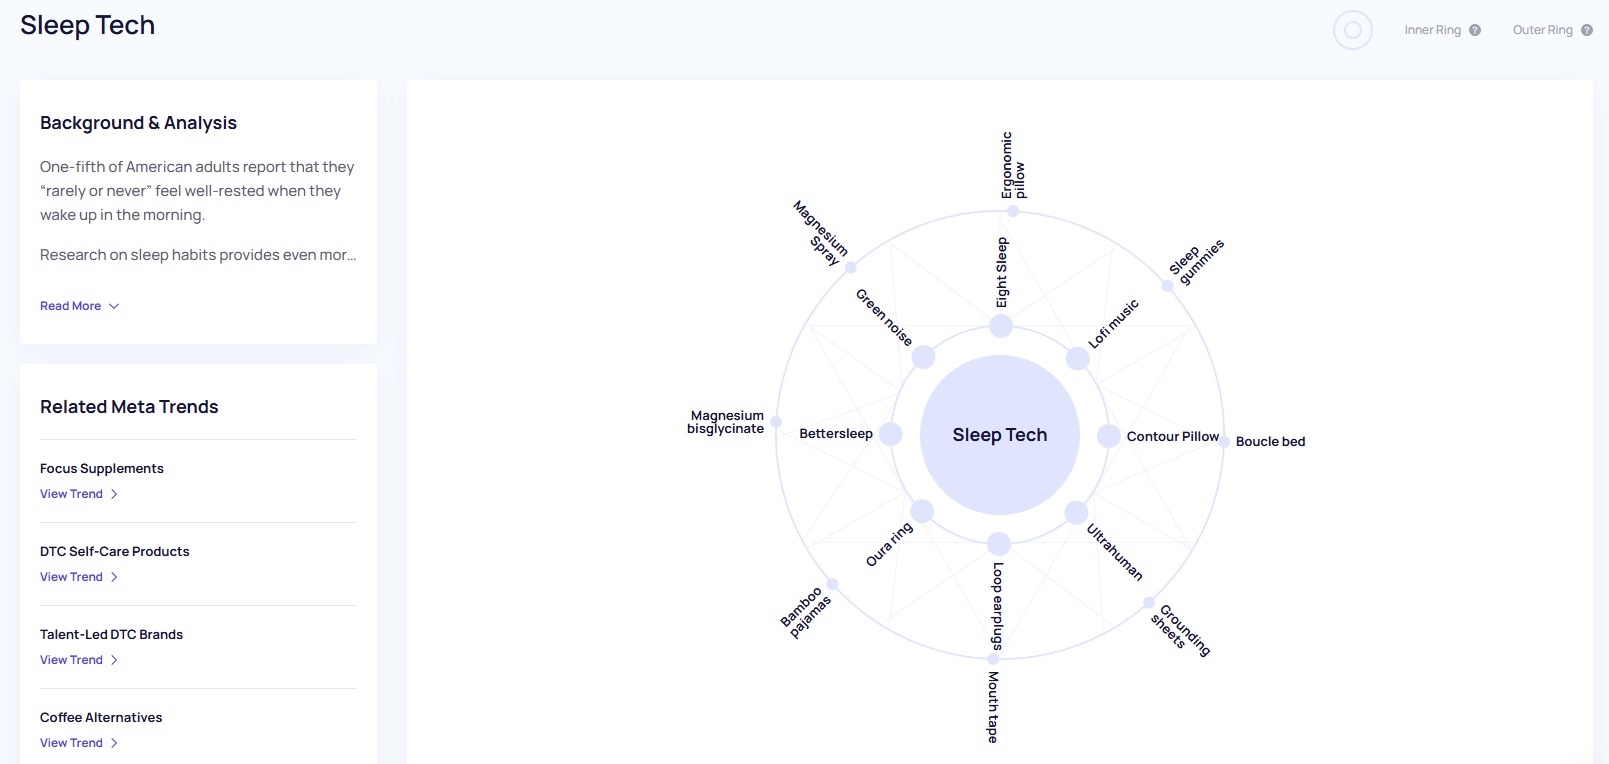
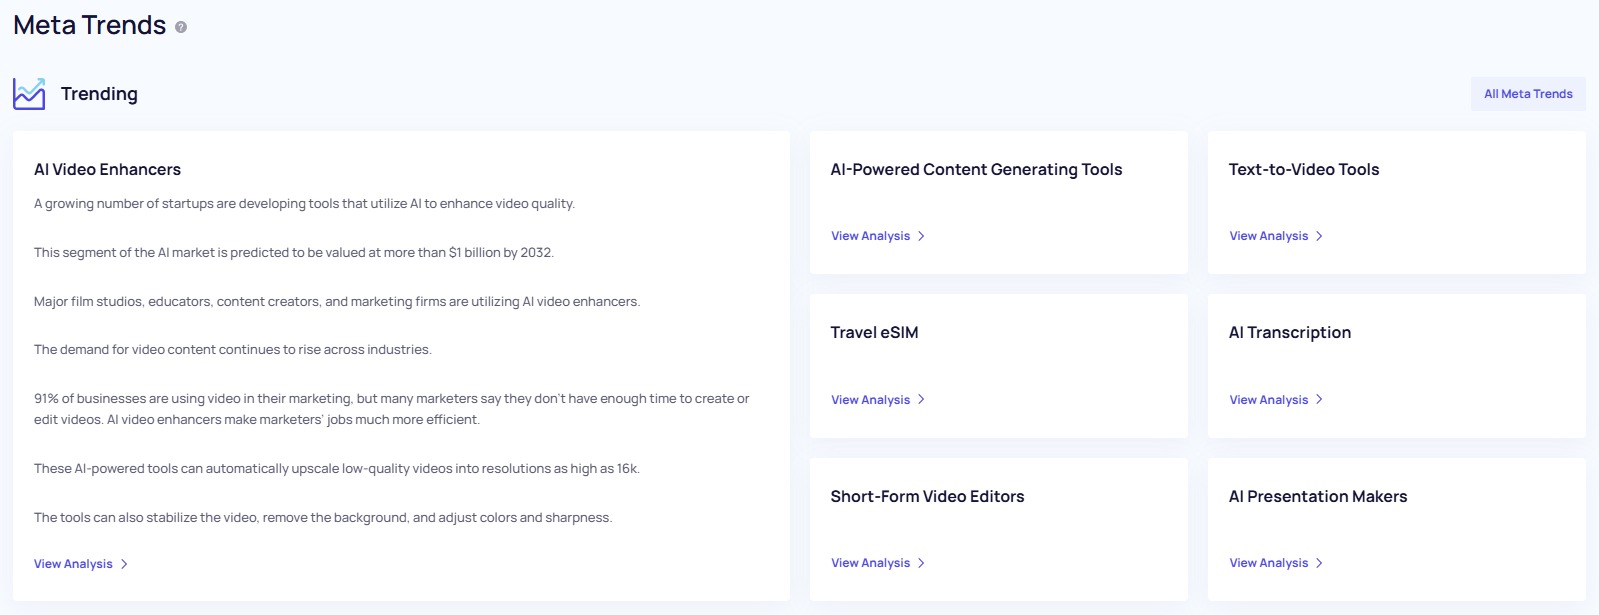
Meta Trends are manually curated by the Exploding Topics research team based on topics within the Trends Database. You can explore them by clicking ‘View Analysis’ on any of the tiles within the Meta Trends section and read a Background & Analysis section written by the research team. Click ‘All Meta Trends’ at the top-right to view every topical macro trend.
Reports Library
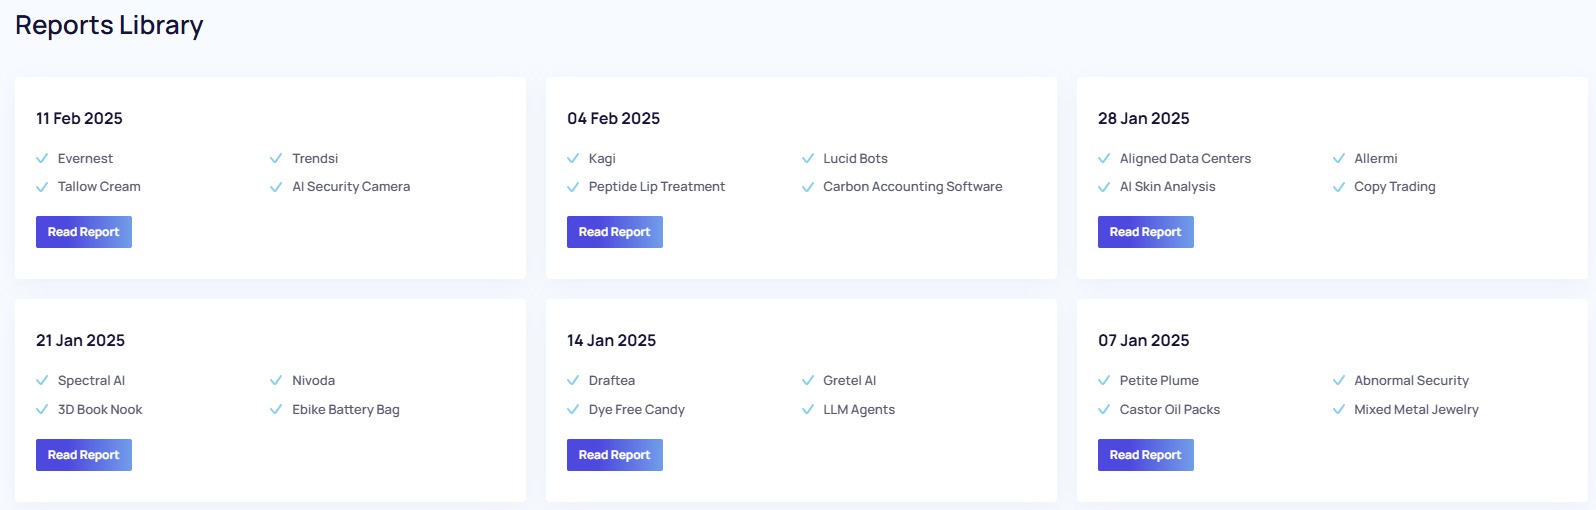
Trend reports in the Reports Library are researched and written by the team of analysts and researchers behind Exploding Topics. Every user on a Business plan receives them via email every Tuesday and can access them via the Reports Library link in the left-hand menu.
API Access
Only available on the Business plan, API access gives users access to the app’s growing index of exclusive trends, proprietary metrics and more. There is a rate limit of 60 requests per minute.
Frequently Asked Questions
The limit to the number of analyses you can run in Exploding Topics resets on the 1st of every month. You can see how many analyses you have remaining within your subscription limit at any time underneath the search bar on the ‘Trend Analysis’ page—this will also tell you how many days you have left until your limit refreshes.
When you cancel your subscription to Exploding Topics, any projects you have created and trends you have tracked within them will be stored for three months before getting permanently deleted.
Trending Startups in Exploding Topics are a subset of the Trends Database that are classified as startup businesses by the app. Additional data points are then gathered from across the web to supplement the startup trend data, such as funding and number of employees.