What Are Log Files?
Log files are documents that record every request made to your server, whether due to a person interacting with your site or a search engine bot crawling it (i.e., discovering your pages).
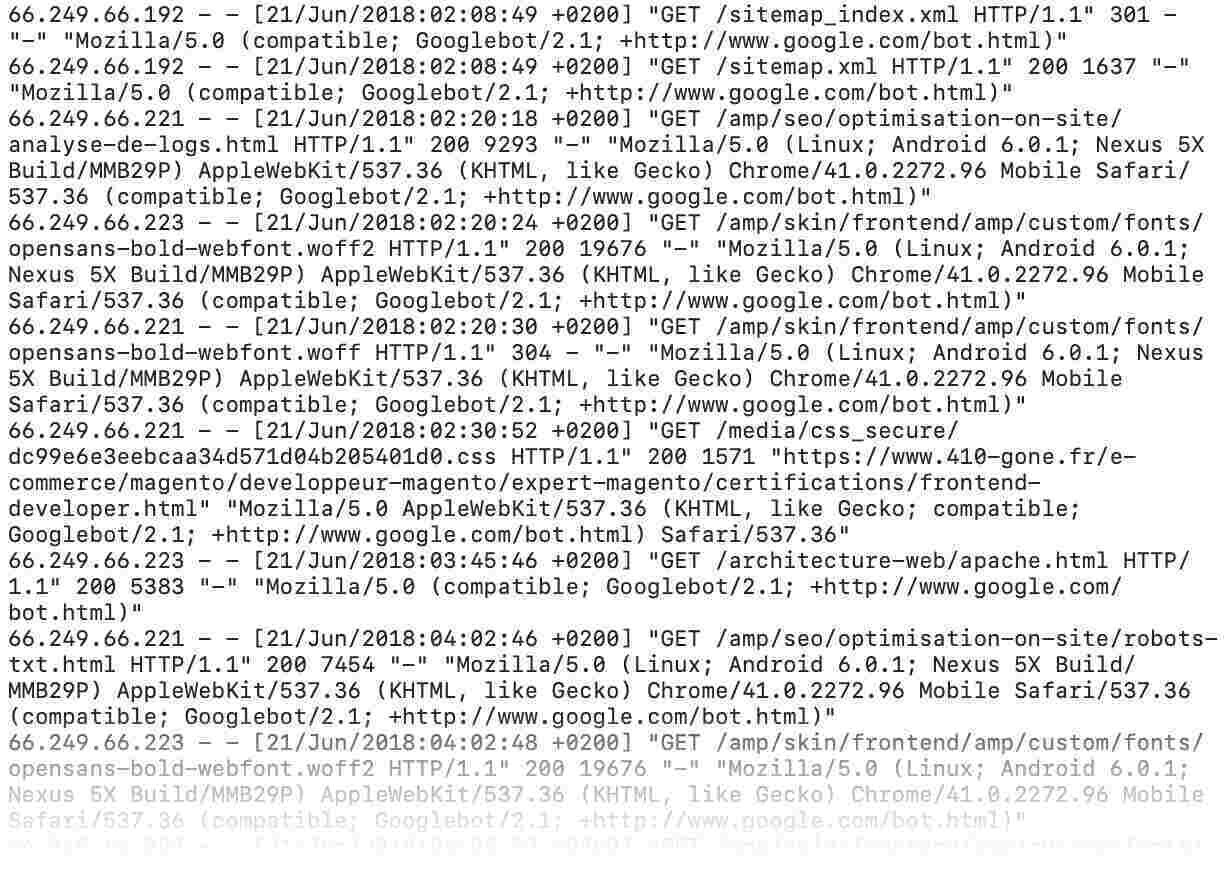
Log files can display important details about:
- The time of the request
- The IP address making the request
- Which bot crawled your site (like Googlebot or DuckDuckBot)
- The type of resource being accessed (like a page or image)
Here’s what a log file can look like:
Servers typically store log files for a limited time, based on your settings, relevant regulatory requirements, and business needs.
What Is Log File Analysis?
Log file analysis is the process of downloading and auditing your site’s log files to proactively identify bugs, crawling issues, and other technical SEO problems.
Analyzing log files can show how Google and other search engines interact with a site. And also reveal crawl errors that affect visibility in search results.
Identifying any issues with your log files can help you start the process of fixing them.
What Is Log File Analysis Used for in SEO?
Log file analysis is used to gather data you can use to improve your site’s crawlability—and ultimately your SEO performance.
This is because it shows you exactly how search engine bots like Googlebot crawl your site.
For example, analysis of log files helps to:
- Discover which pages search engine bots crawl the most and least
- Find out whether search crawlers can access your most important pages
- See if there are low-value pages that are wasting your crawl budget (i.e., the time and resources search engines will devote to crawling before moving on)
- Detect technical issues like HTTP status code errors (like “error 404 page not found”) and broken redirects that prevent search engines from accessing your content
- Uncover URLs with slow page speed, which can negatively impact your performance in search rankings
- Identify orphan pages (i.e., pages with no internal links pointing to them) that search engines may miss
- Track spikes or drops in crawl frequency that may signal other technical problems
How to Analyze Log Files
Now that you know some of the benefits of doing log file analysis for SEO, let's look at how to do it.
You’ll need:
- Your website's server log files
- Access to a log file analyzer
1. Access Log Files
Access your website’s log files by downloading them from your server.
Some hosting platforms (like Hostinger) have a built-in file manager where you can find and download your log files.
Here’s how to do it.
From your dashboard or control panel, look for a folder named “file management,” “files,” “file manager,” or something similar.
Here’s what that folder looks like on Hostinger:
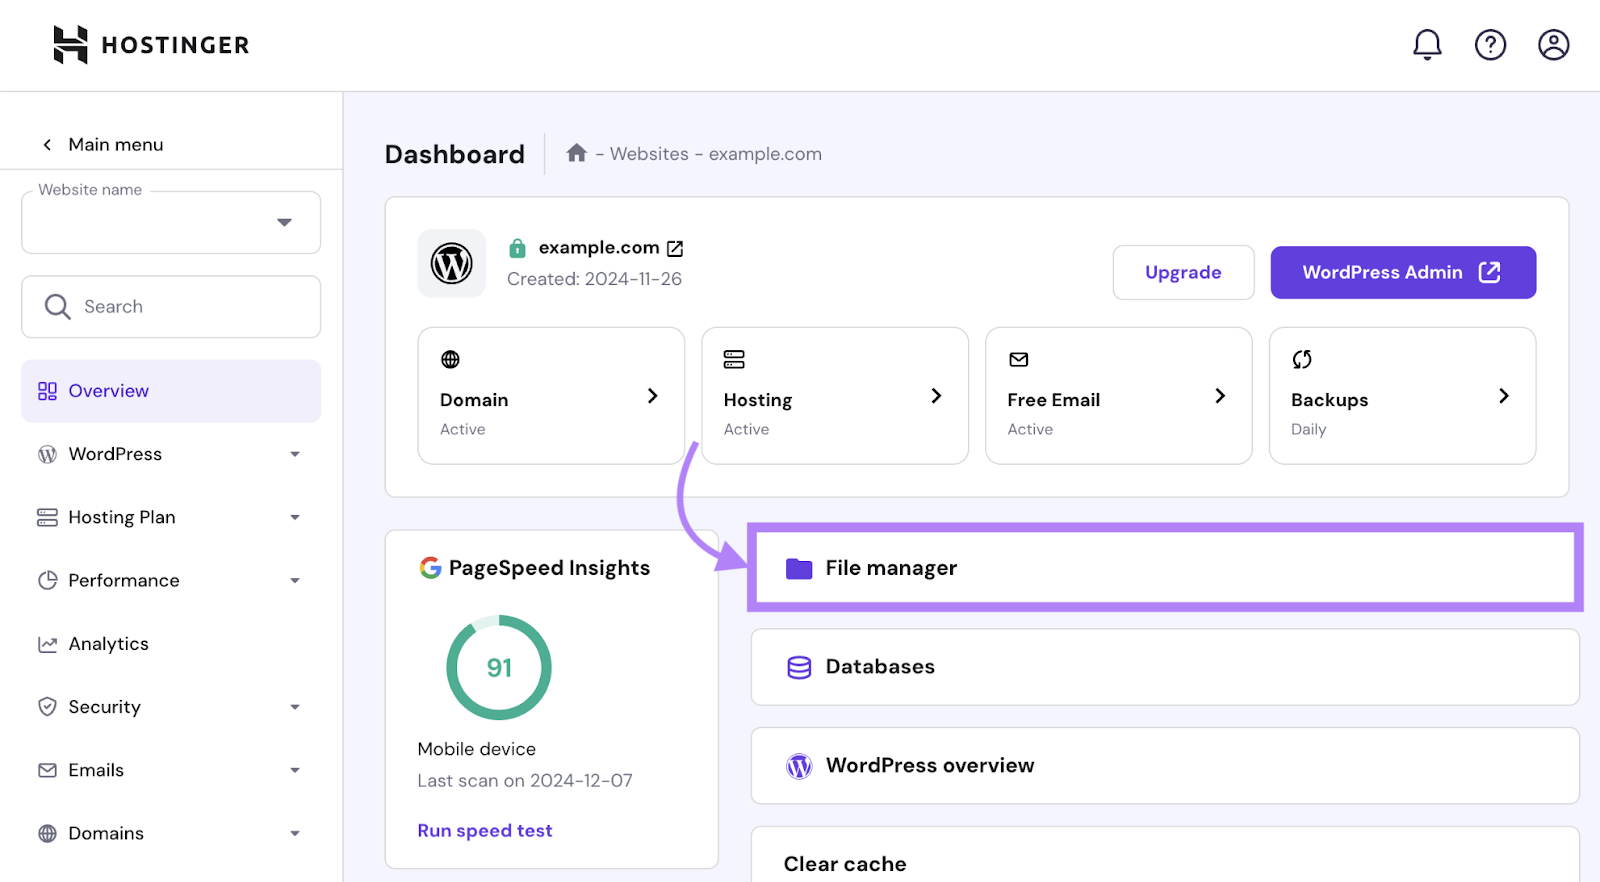
Just open the folder, find your log files (typically in the “.logs” folder), and download the needed files.
Alternatively, your developer or IT specialist can access the server and download the files through a file transfer protocol (FTP) client like FileZilla.
Once you’ve downloaded your log files, it’s time to analyze them.
2. Analyze Log Files
You can analyze log files manually using Google Sheets and other tools, but this process can get both tiresome and messy really quickly.
Which is why we recommend using Semrush’s Log File Analyzer.
First, make sure your log files are unarchived and in the access.log, W3C, or Kinsta file format.
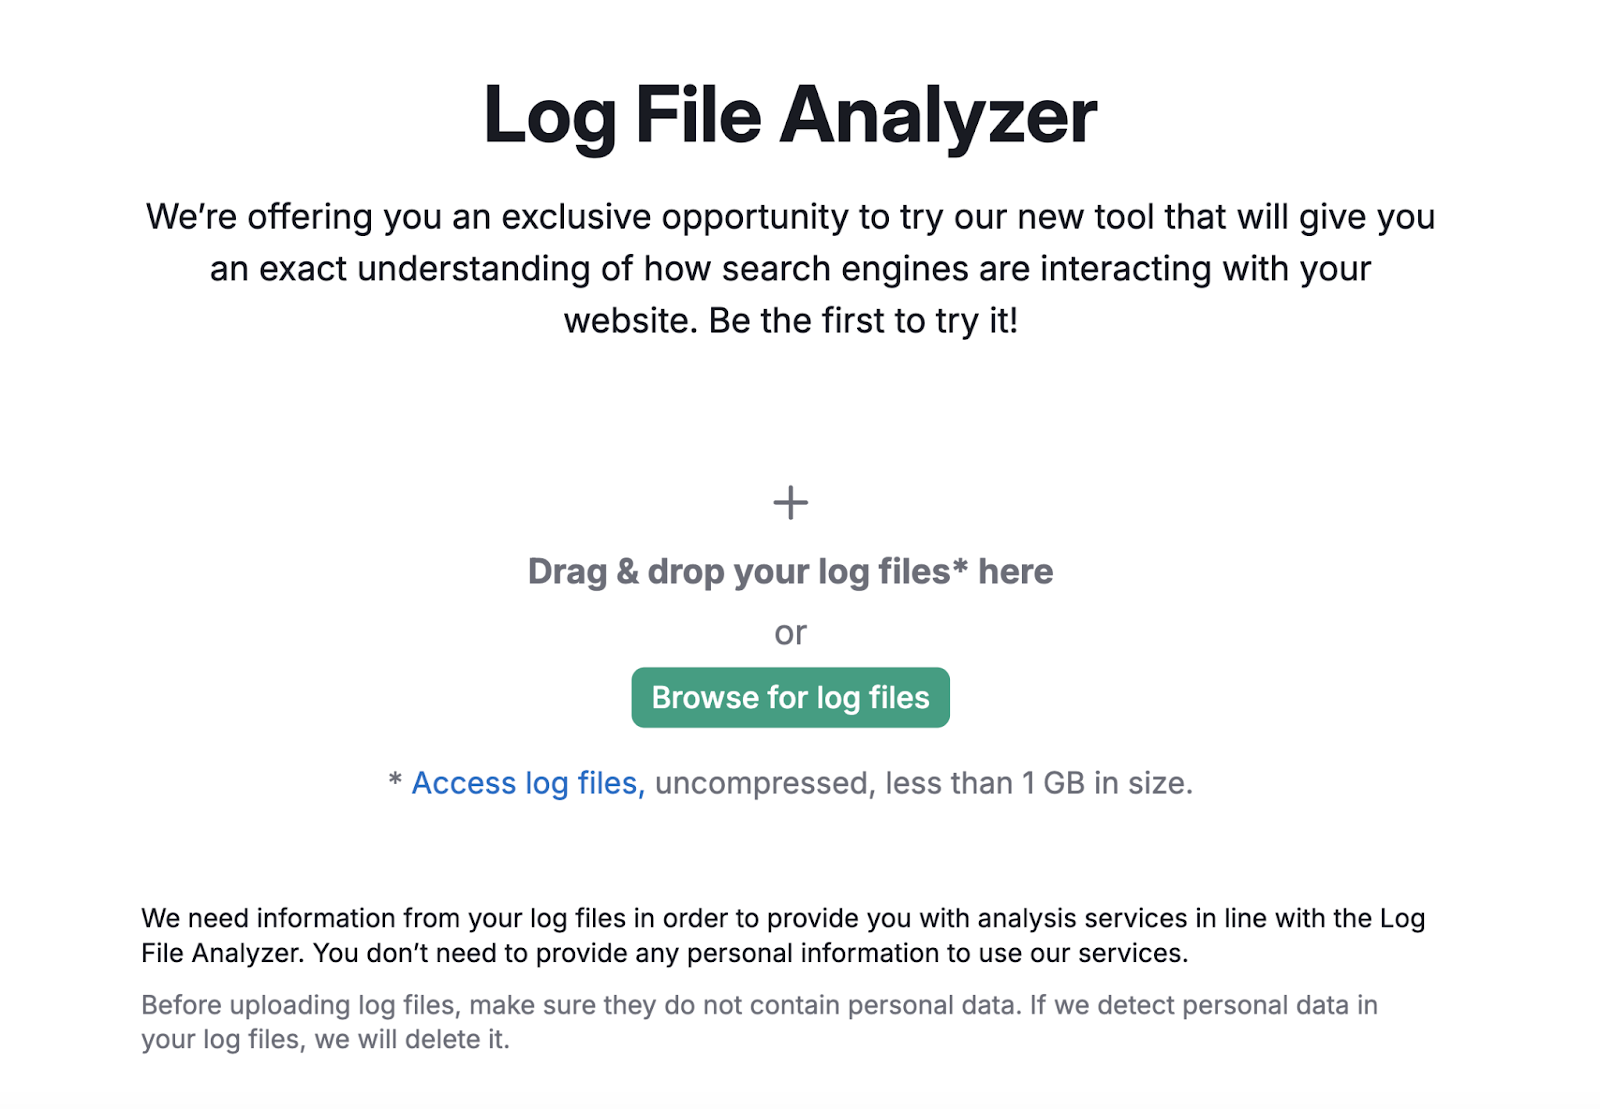
Then, drag and drop your files into the tool. And click “Start Log File Analyzer.”
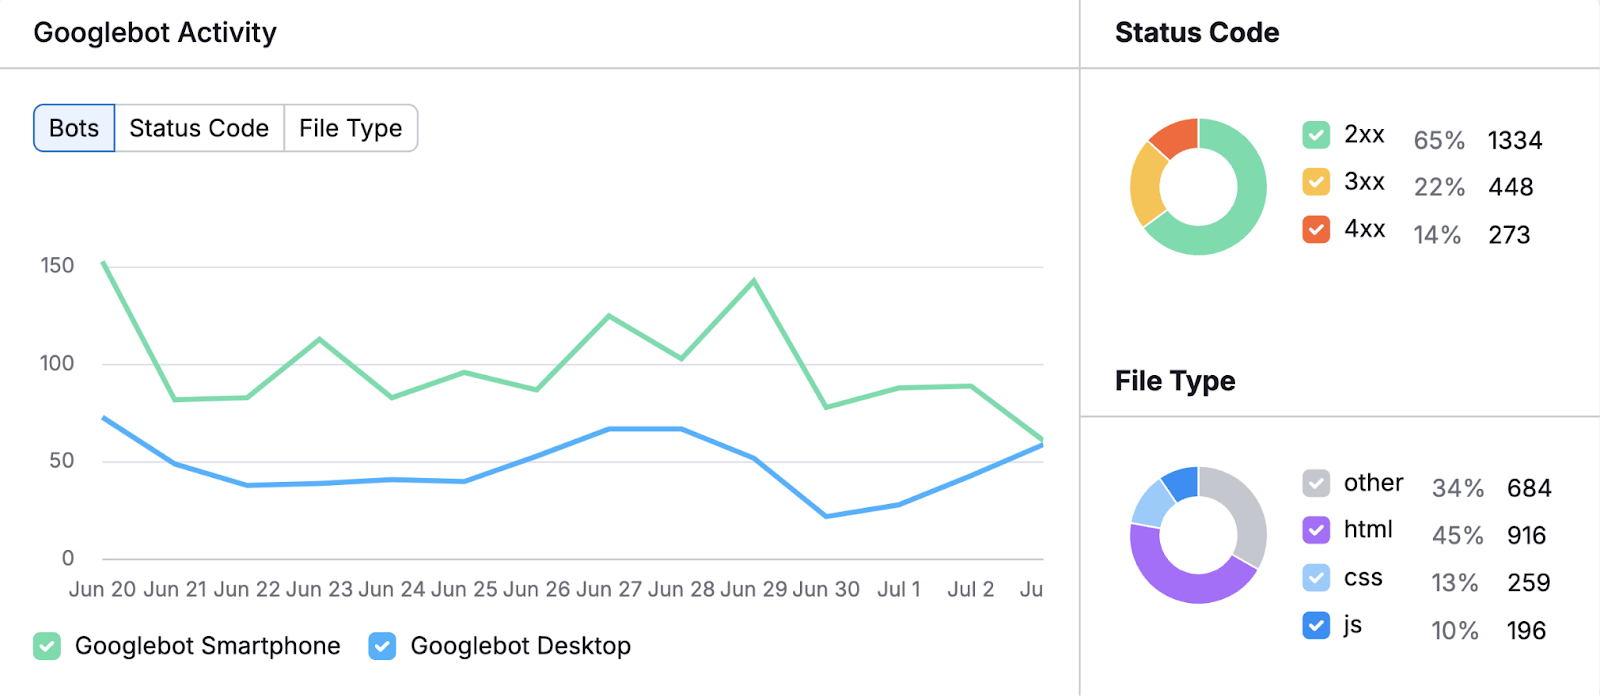
Once your results are ready, you’ll see a chart showing Googlebot activity over the last 30 days.
Monitor this chart to find any unusual spikes or drops in activity, which can indicate changes in how search engines crawl your site or problems that need fixing.
To the right of the chart, you’ll also see a breakdown of:
- HTTP status codes: These codes show whether search engines and users can successfully access your site’s pages. For example, too many 4xx errors might indicate broken links or missing pages that you should fix.
- File types crawled: Knowing how much time search engine bots spend crawling different file types shows how search engines interact with your content. This helps you identify if they’re spending too much time on unnecessary resources (e.g., JavaScript) instead of prioritizing important content (e.g., HTML).
Scroll down to “Hits by Pages” for more specific insights. This report will show you:
- Which pages and folders search engine bots crawl most often
- How frequently search engine bots crawl those pages
- HTTP errors like 404s
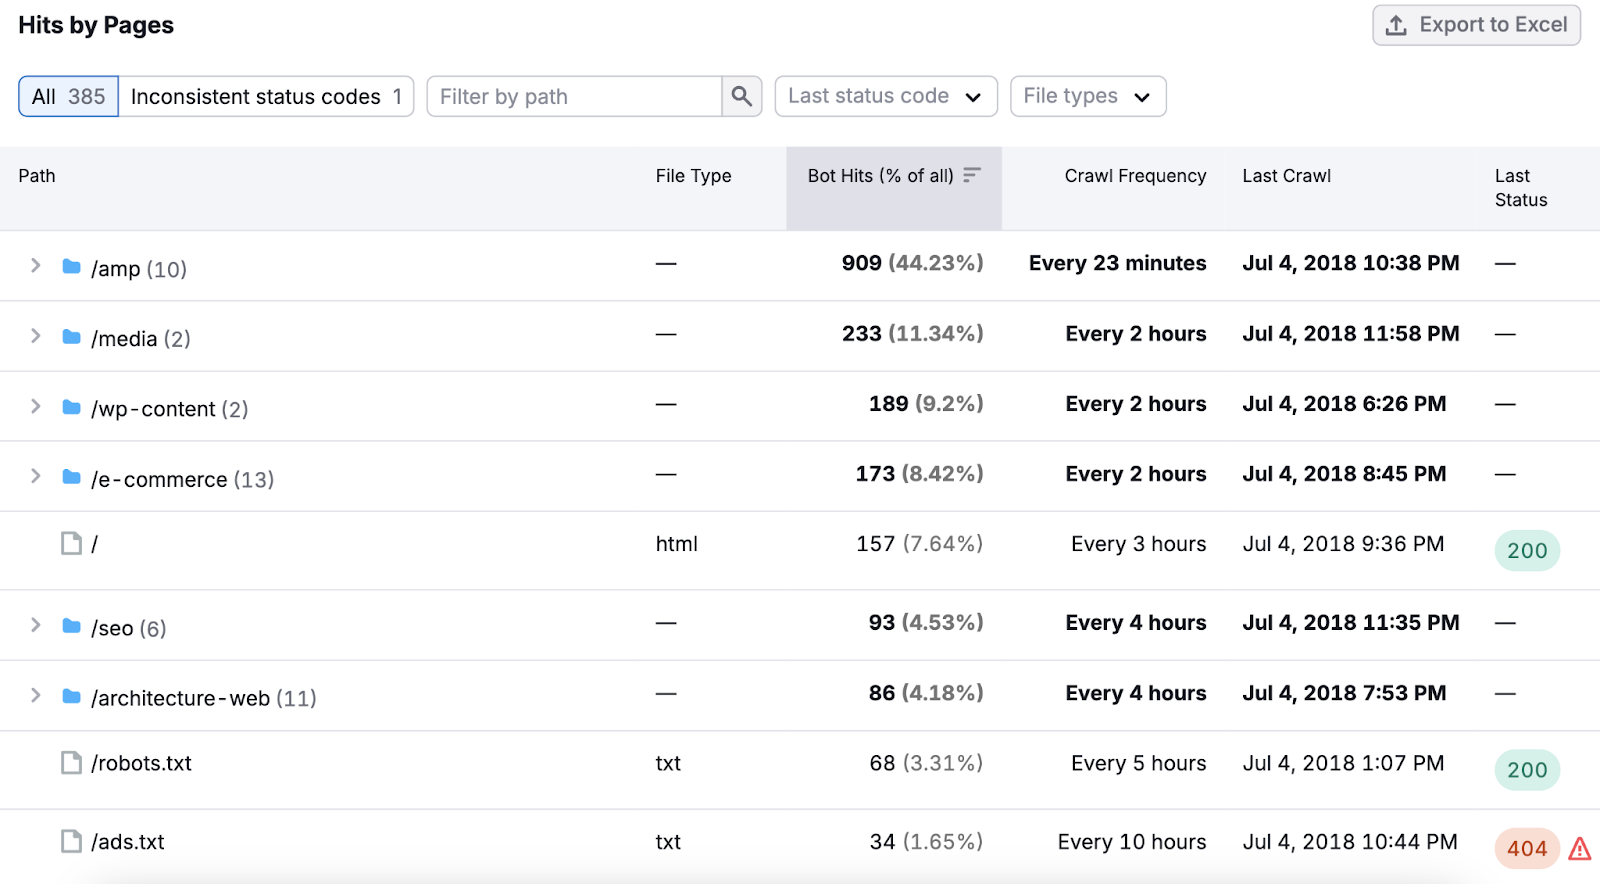
Sort the table by “Crawl Frequency” to see how Google allocates your crawl budget.
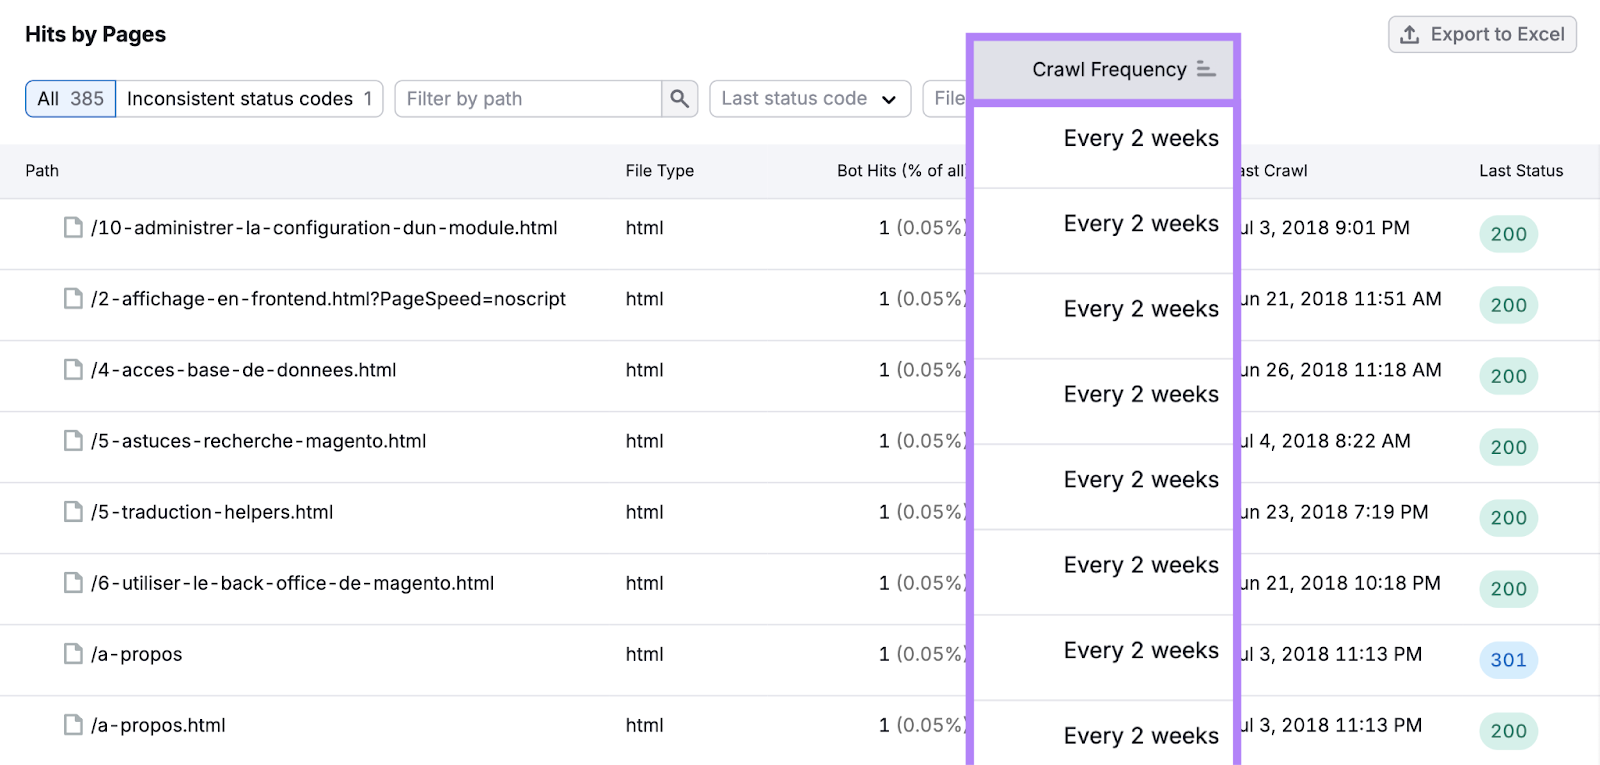
Or, click the “Inconsistent status codes” button to see paths (a URL’s specific route) with inconsistent status codes.

For example, a path switching between a 404 status code (meaning a page can’t be found) and a 301 status code (a permanent redirect) could signal misconfigurations or other issues.
Pay particular attention to your most important pages. And use the insights you gain about them to make adjustments that might improve your performance in search results.
Prioritize Site Crawlability
Now you know how to access and analyze your log files.
But don’t stop there.
Take proactive steps to make sure your site is optimized for crawlability.
One way to ensure to do that is to conduct a technical SEO audit using Semrush’s Site Audit tool.
First, open the tool and configure the settings by following our configuration guide. (Or stick with the default settings.)
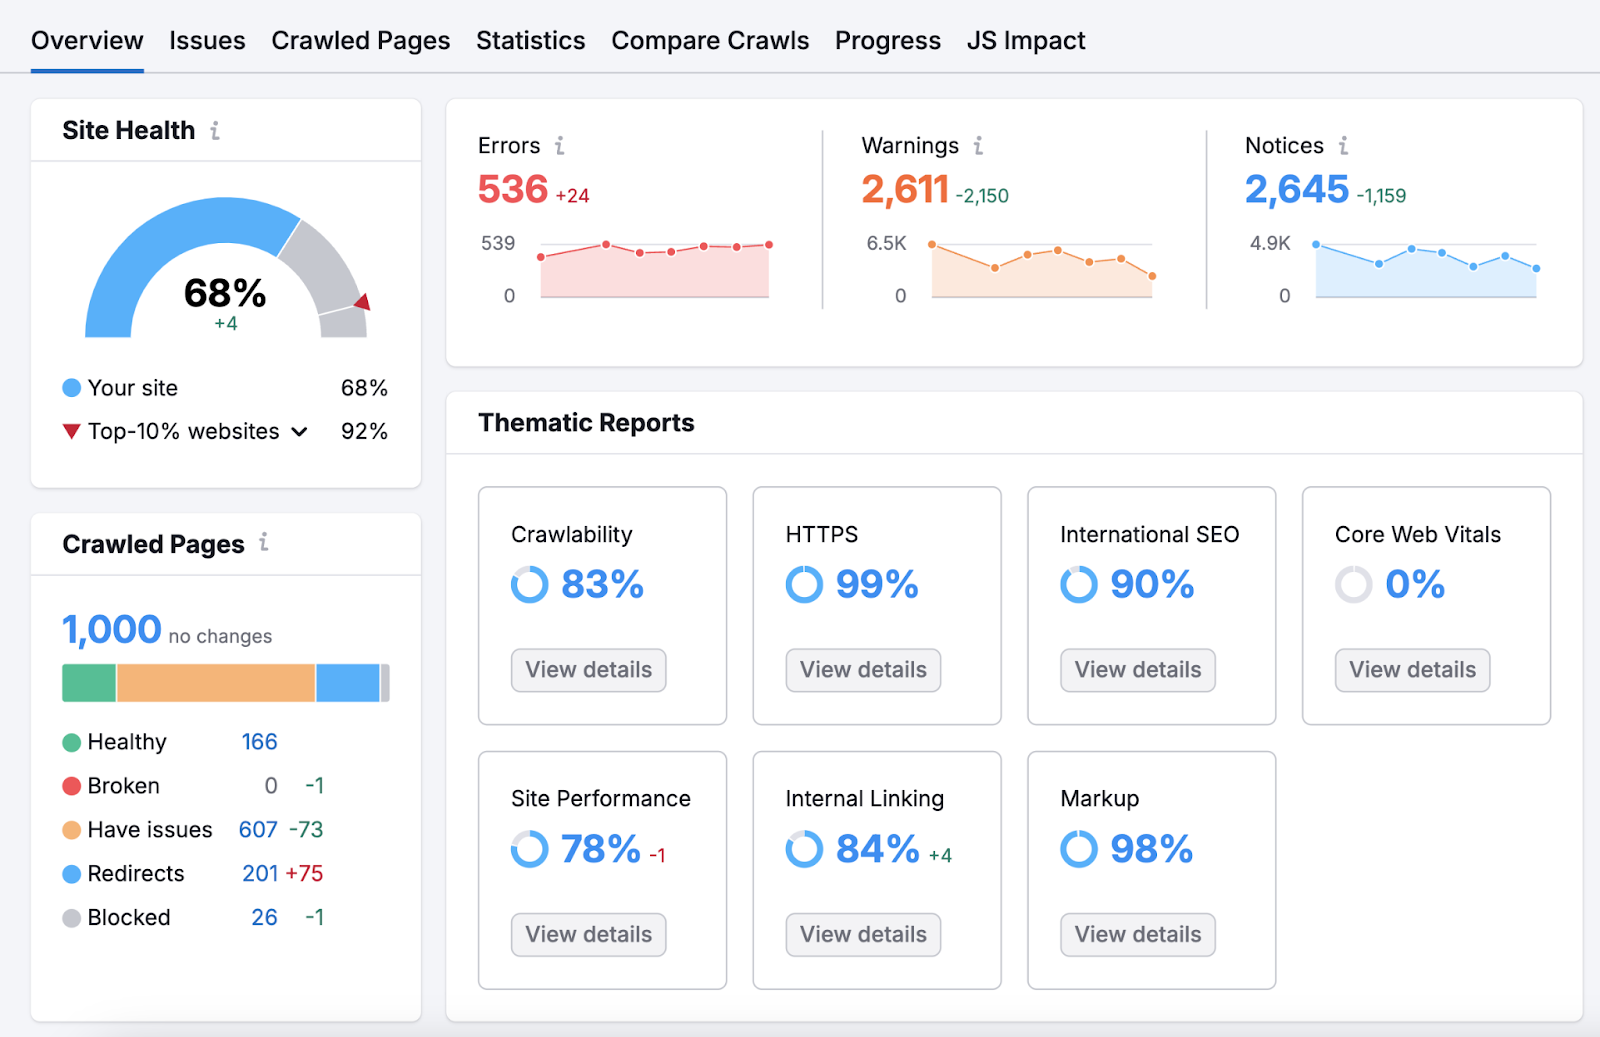
Once your report is ready, you’ll see an overview page that highlights your site’s most important technical SEO issues and areas for improvement.
Head to the “Issues” tab and select “Crawlability” in the “Category” drop-down.
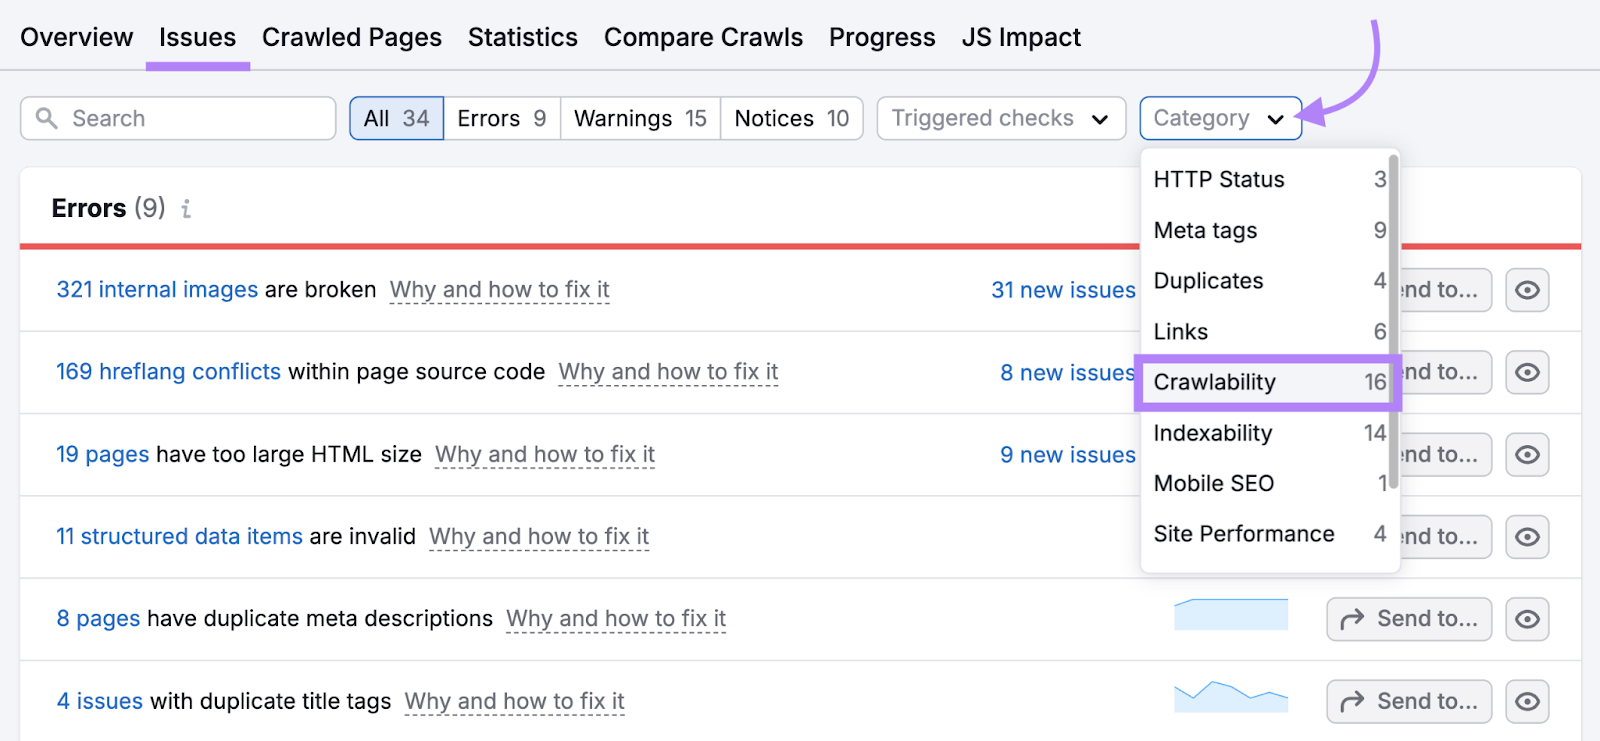
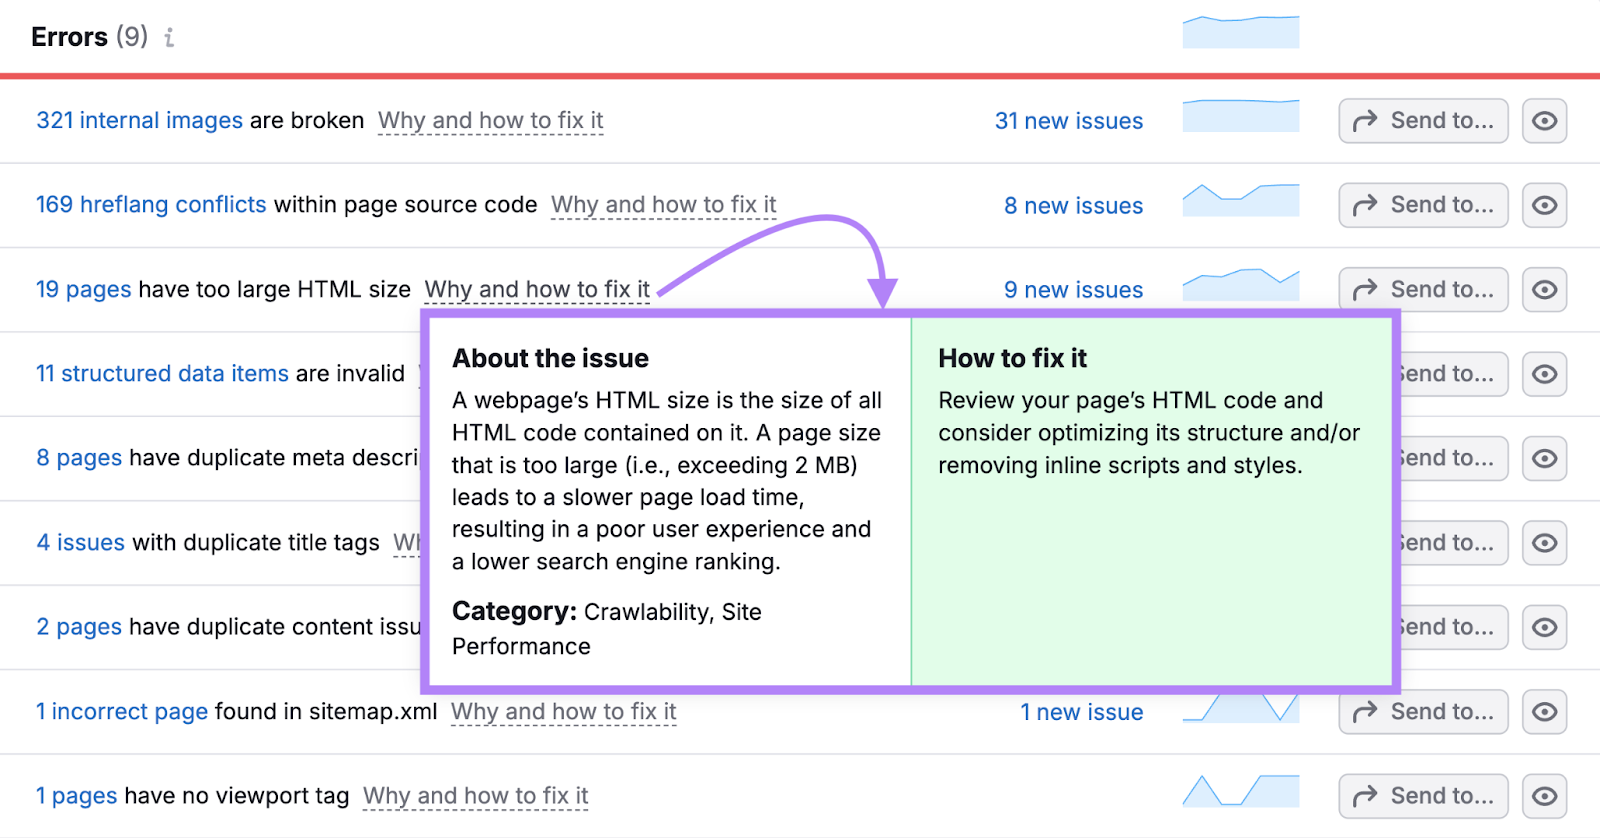
You’ll see a list of issues affecting your site’s crawlability.
If you don’t know what an issue means or how to address it, click on “Why and how to fix it” to learn more.
Run a site audit like this every month. And iron out any issues that pop up, either by yourself or by working with a developer.
