What Is Conversion Rate Optimization?
Conversion rate optimization (CRO) is the process of increasing the percentage of visitors who take a desired action (purchasing, signing up for a free trial, booking a demo. etc.) on your website or mobile app.
It’s important because converting more visitors into leads and customers can grow your business. And can be calculated by dividing your number of conversions by the number of visitors, and then multiplying that by 100.
Here’s what the formula looks like:

CRO often involves:
- Tracking where visitors come from, how they navigate your site, and where they drop off
- Conducting surveys and A/B tests to know your audience’s needs, preferences, and pain points
- Improving website design, content, and calls to action (CTAs) to create a better user experience that drives conversions
Let’s say you run an ecommerce store with the following stats:
- Monthly visitors: 100,000
- Current conversion rate: 2%
- Average order value (AOV): $50
With these numbers, your current monthly revenue is: 100,000 x 0.02 x 50 = $100,000
Now imagine that you increase your conversion rate from 2% to 2.5% by implementing some CRO techniques.
Your new monthly revenue becomes: 100,000 x 0.025 x 50 = $125,000
That’s a 25% increase in revenue—an additional $25,000 per month—gained without spending extra money on traffic acquisition.
How to Do Conversion Rate Optimization in 6 Steps
Here’s a six-step process to help you optimize your conversions:
1. Set Your Conversion Goals
Start by identifying important conversions that align with your business objectives.
These can vary based on your niche.
For an enterprise software company, increasing demo requests could be a conversion goal. Whereas an ecommerce business could be looking at orders as a conversion goal.
Once you have a clear idea about your target conversions, add them as key events in Google Analytics 4 (GA4) to set up conversion tracking. (Read our detailed guide to set up GA4 conversion tracking to learn more).

Then, check your current performance.
If 1,000 people visited your website and 50 of them converted, your conversion rate is: (50 / 1000) x 100 = 5%
Now, compare your current conversion rate to industry benchmarks to get a sense of how you’re performing.
For example, the average conversion rate for ecommerce sites is 4.2%. But for legal and financial services, it’s 6.3% and 8.3% respectively, according to Unbounce’s Conversion Benchmark Report.
If your conversion rate is below the industry average, there's likely room for improvement.
2. Identify Where Users Drop Off
Next, use custom funnel reports in GA4 to analyze your users’ journeys, the steps they take to complete specific tasks on your site, and the number of visitors that drop off in between these steps.
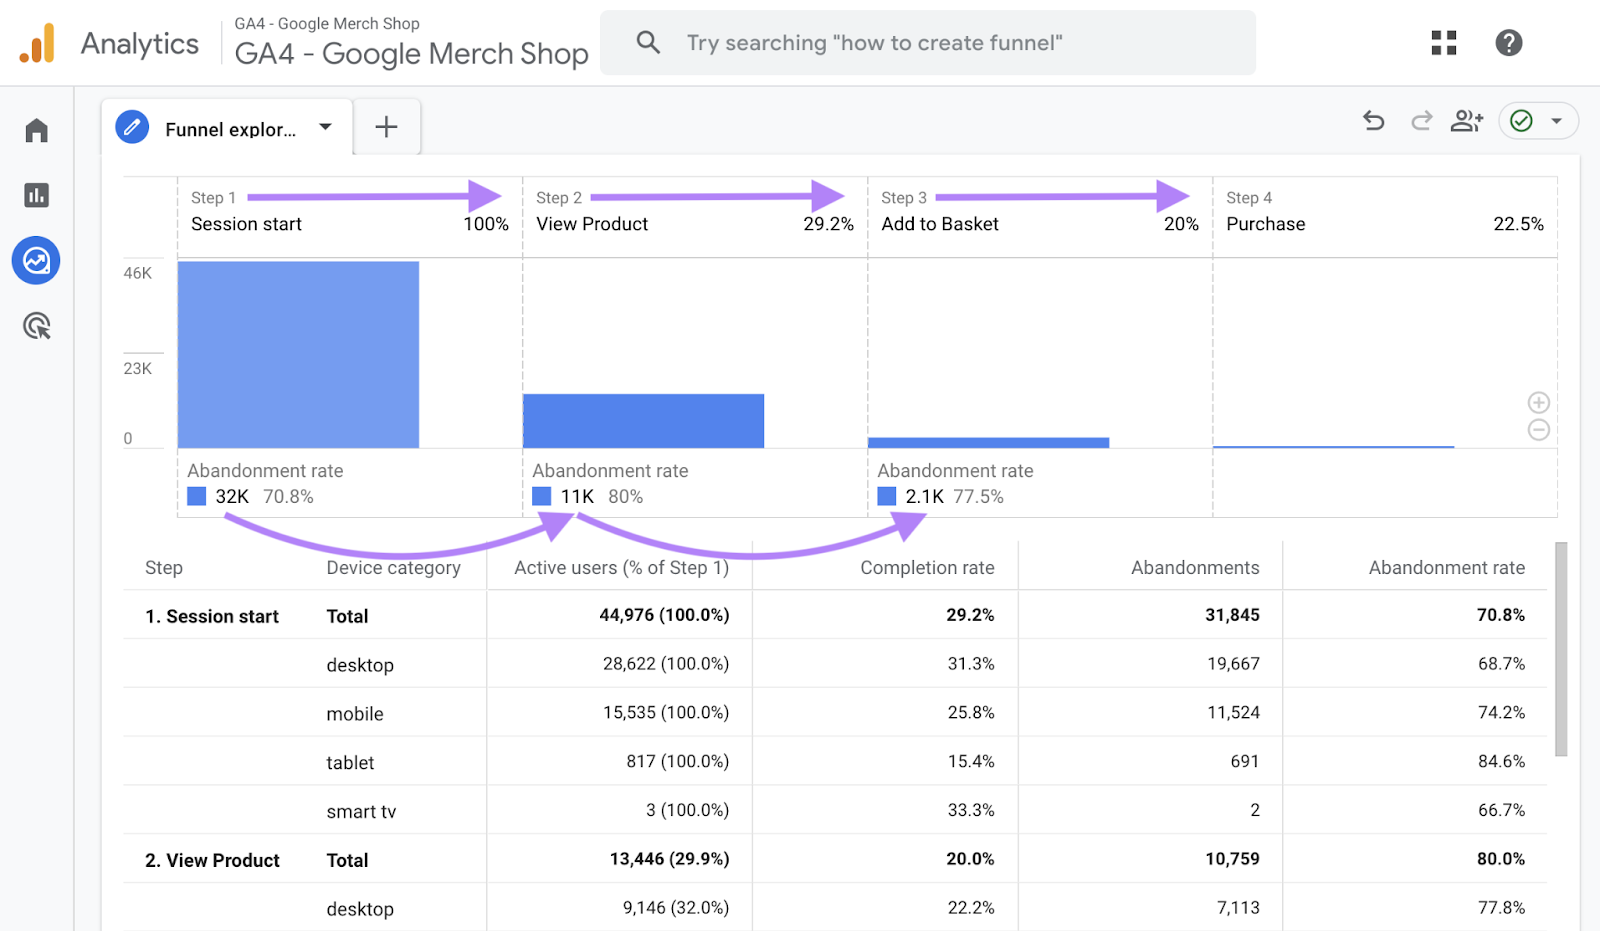
This will help you identify the pages or steps in your funnel where users leave without converting.
Some examples of pages that you might want to pay attention to include your homepage, pricing pages, checkout pages, and landing pages.
Also analyze these key metrics in your GA4 to understand the important factors impacting your conversion rates:
- Bounce rate: This is the percentage of visitors who leave without engaging. Pay close attention to the bounce rate on your landing pages and product pages. High bounce rates on these pages may indicate you need to improve your messaging and/or user experience.
- Cart abandonment rate: This tells you how often users leave their shopping carts without purchasing. Analyze abandonment rates and checkout steps to identify friction points (e.g., high shipping costs or lengthy forms).
- Time on page: Low time on page could indicate that users aren’t finding your content valuable. Or that they’re distracted by other elements on the page.
- Scroll depth: Track how far users scroll to see if they are reaching important elements like CTAs or forms. If not, consider adjusting the layout.
It’s a good idea to use tools like Hotjar or Crazy Egg to more fully understand how users interact with your site. And where exactly they face issues.
You can use these insights when creating hypotheses for your CRO experiments later on.
3. Gather Data About Your Users
Once you’ve identified your drop-off points, gather user data to find out what could be making users leave your site without converting.
You can get this information through online surveys or feedback forms. Ask questions like:
- What stopped you from completing your purchase today? (To get direct feedback on issues like unreasonable pricing, lack of trust, or poor usability.)
- Was there anything confusing or frustrating about the process? (To uncover pain points in navigation, the payment gateway, etc.)
- Was there anything you were looking for today that you couldn’t find? (To identify gaps in your content or product offerings.)
- Did you experience any technical issues during your visit? (To identify glitches that could disrupt the buyer’s journey.)
- On a scale of 1-10, how easy was it to complete your goal on our site? (To quantify the overall user experience of your site.)
Next, collect information about your larger target audience.
Gather this data with ease using the One2Target tool.
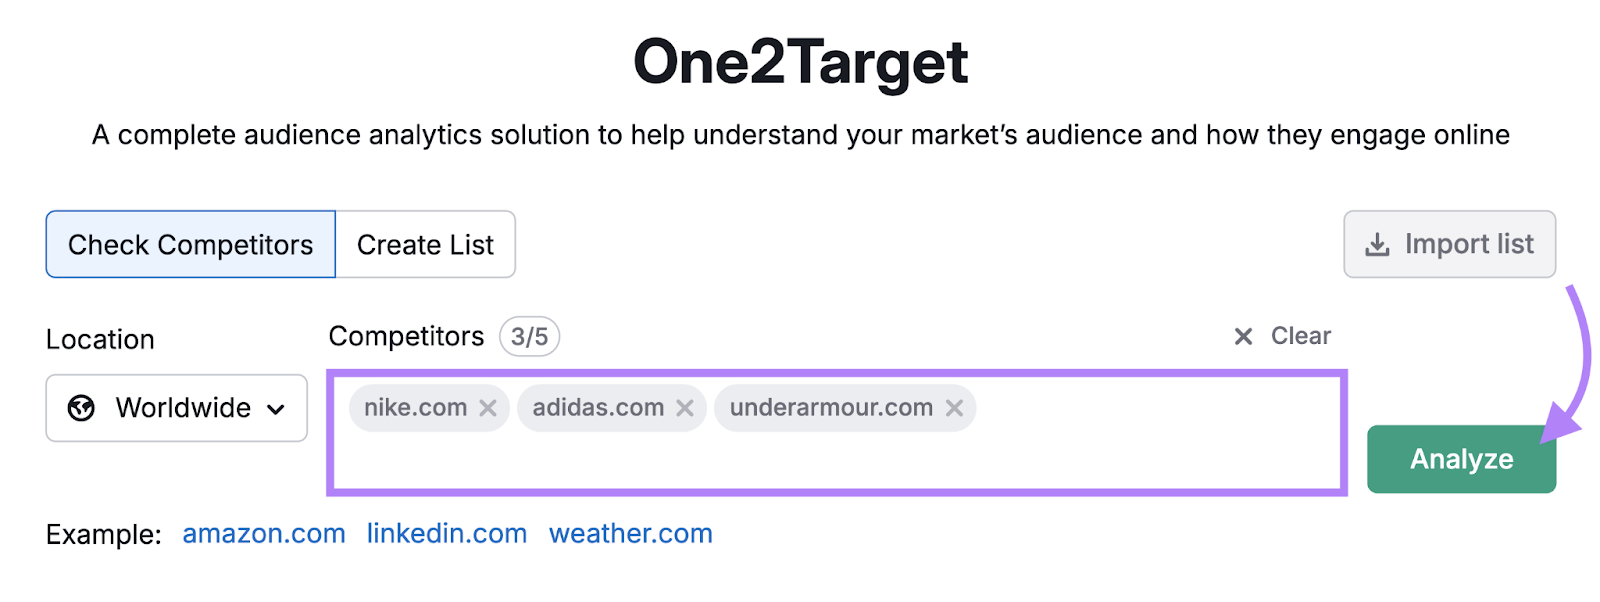
Launch the tool, enter up to five domains in your niche, and click “Analyze.”
(Your target audience is likely to be very similar to or the same as your main rivals’).
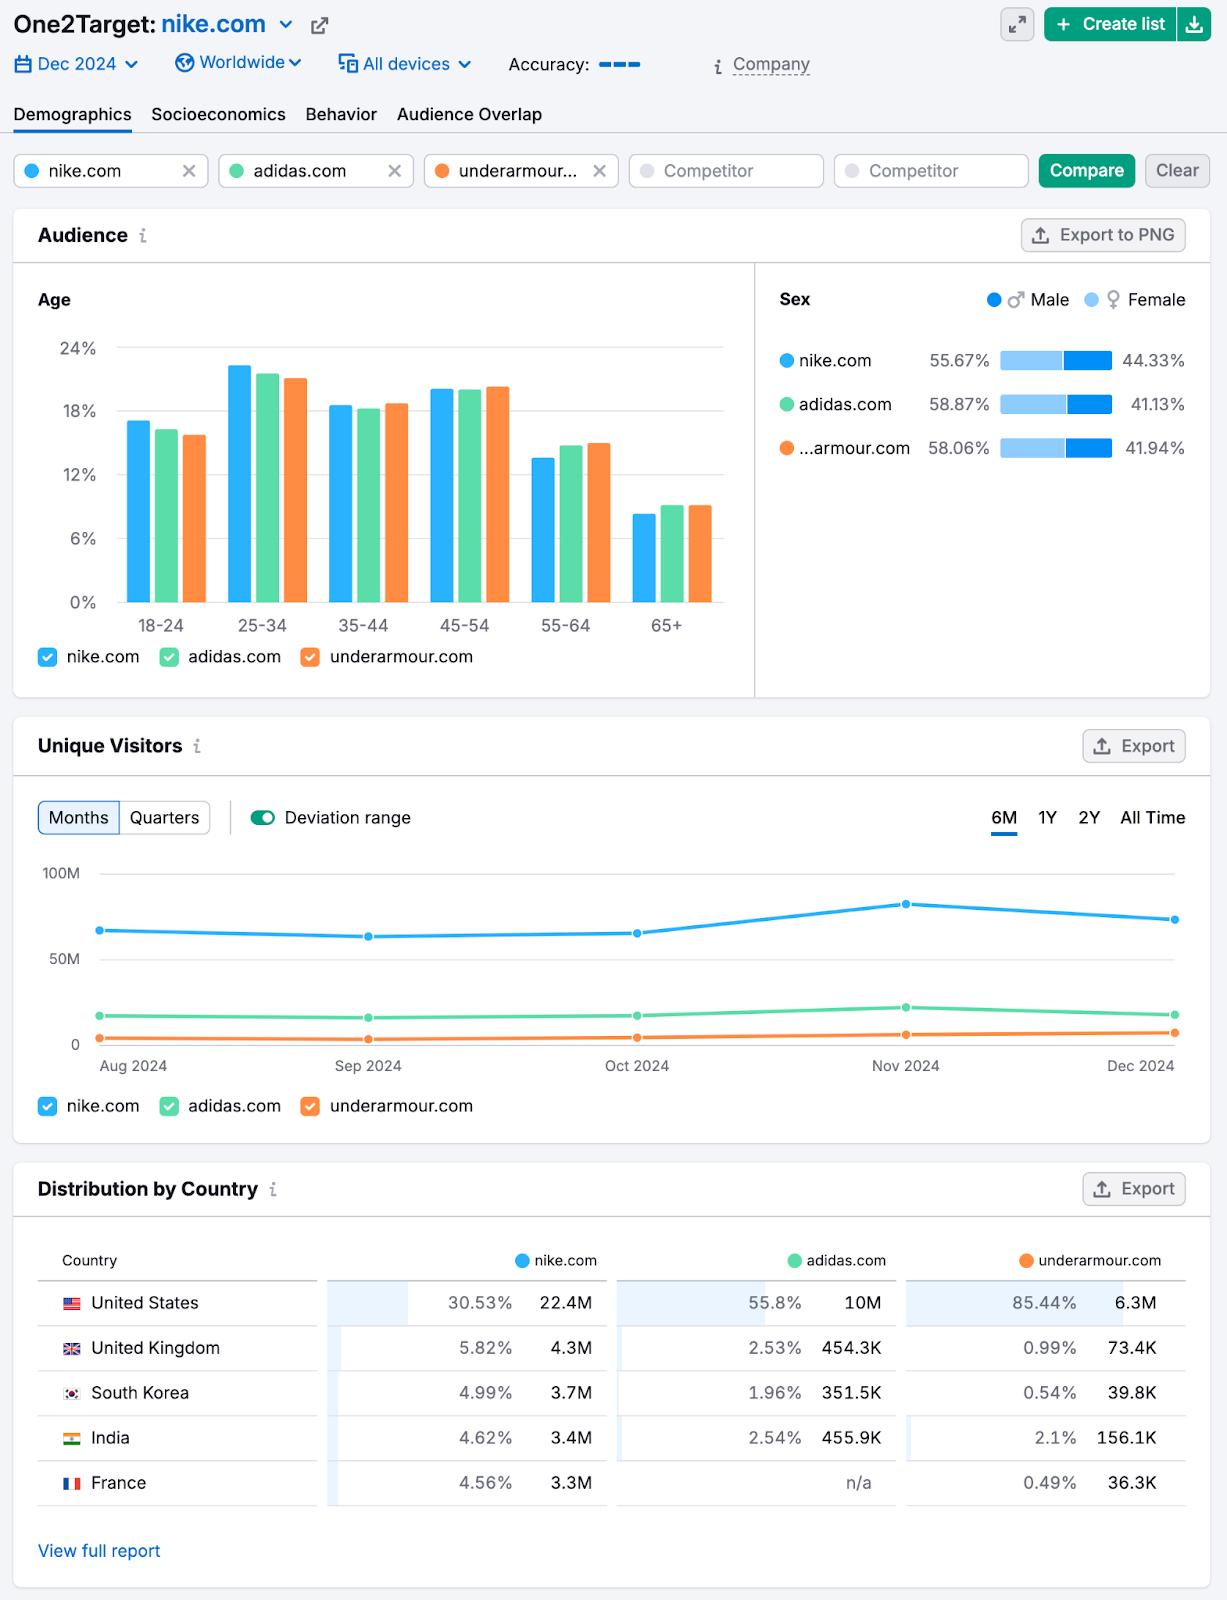
The “Demographics” tab shows information like age groups, gender, and location.
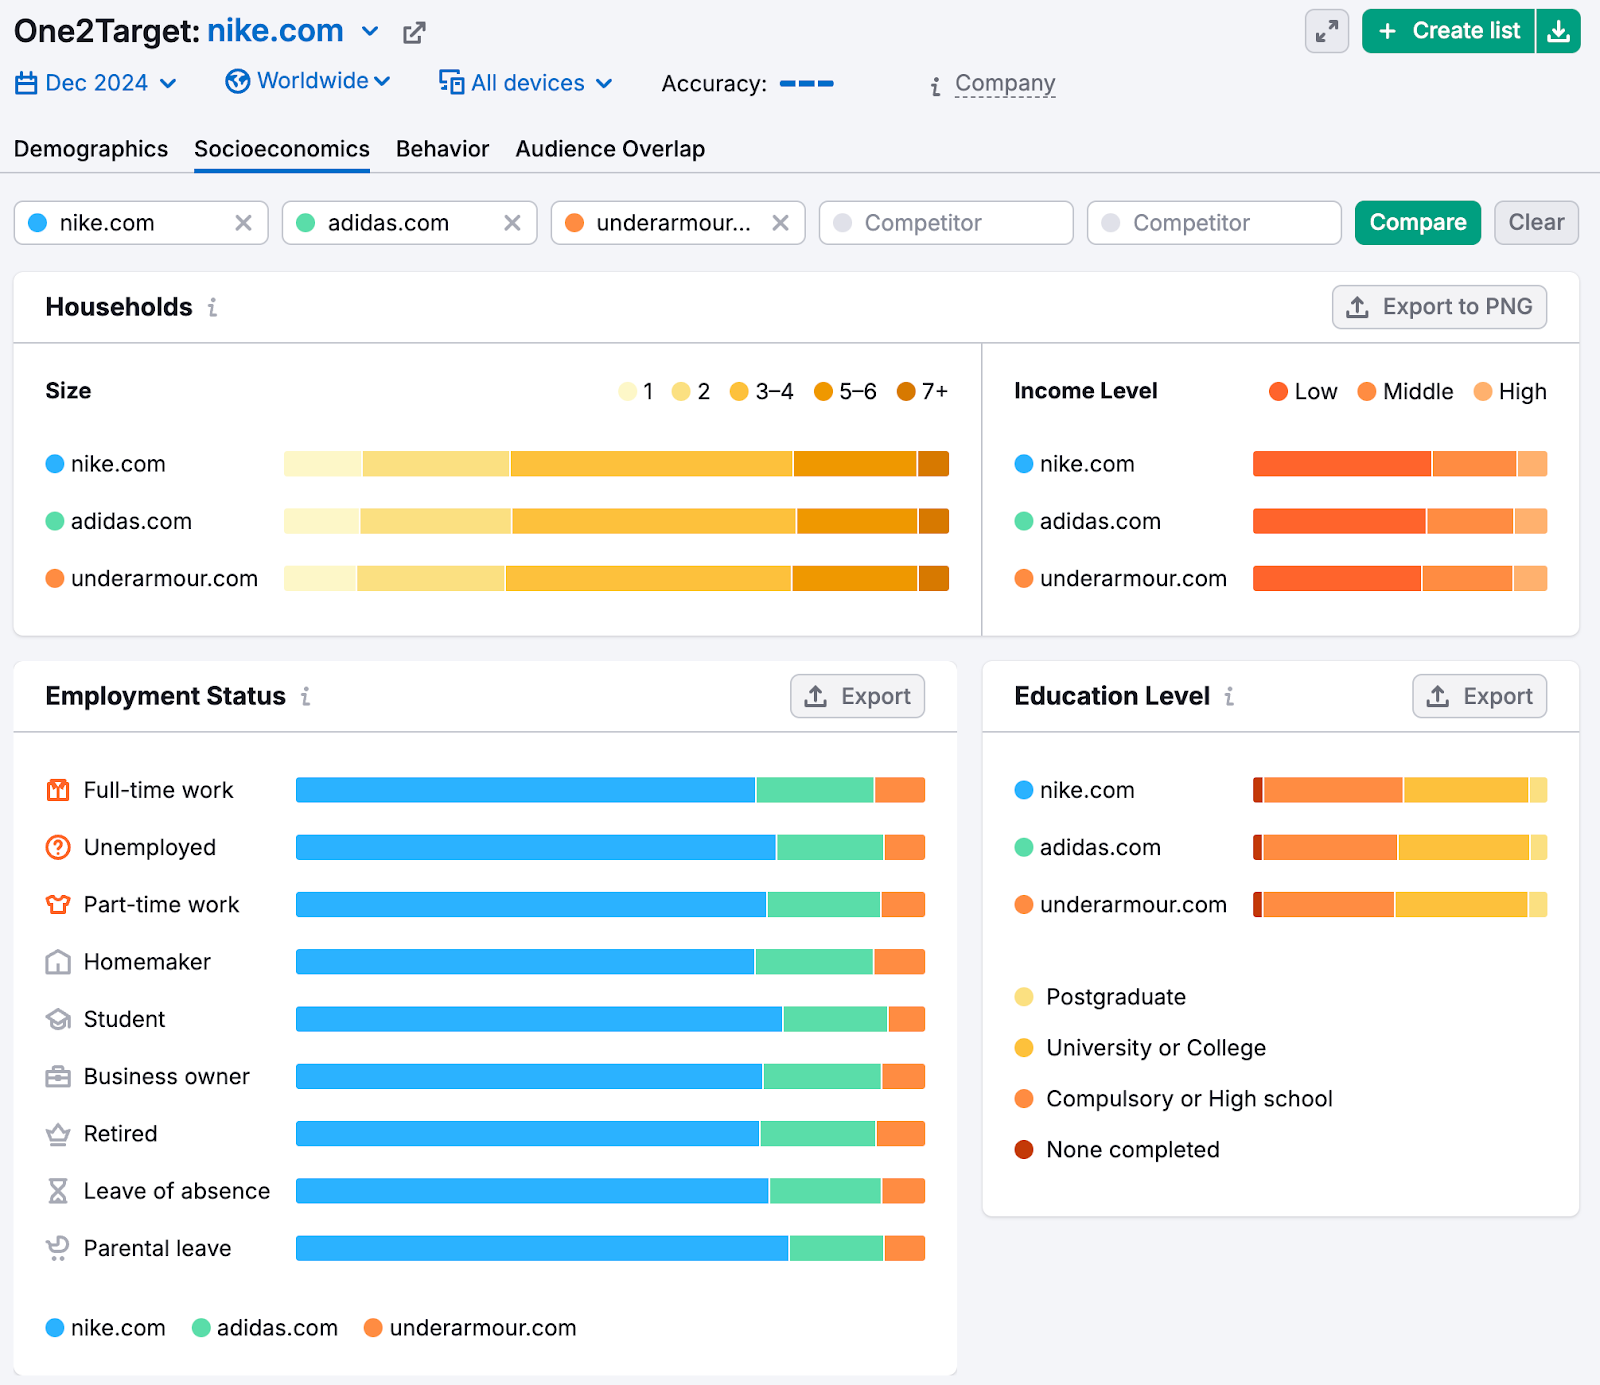
Head to the “Socioeconomics” tab to find details about your audience’s average household size, employment status, income level, and education level.
Click the “Behavior” tab to get insights into users’ preferred devices, websites, and social media platforms.
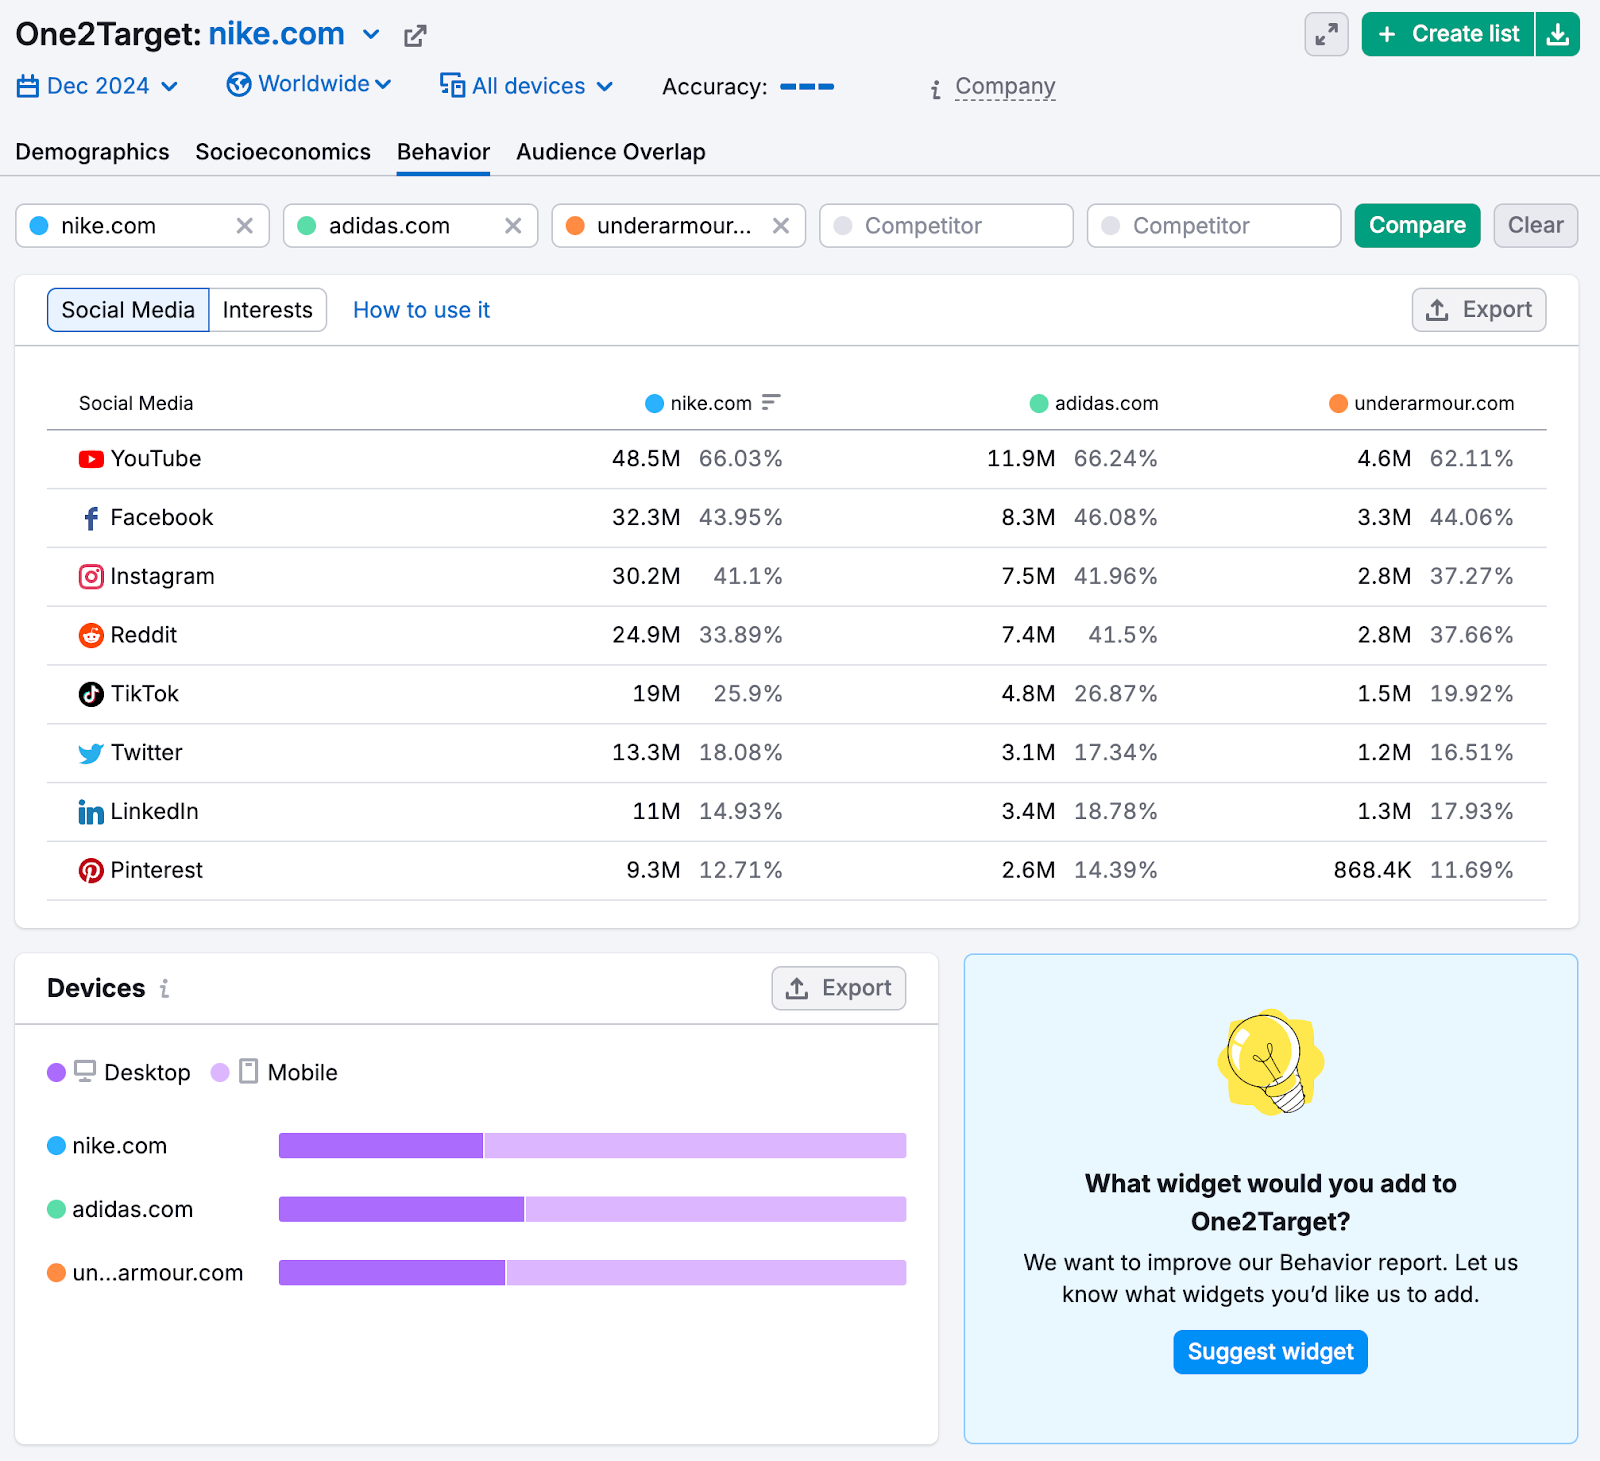
Use this information to refine your messaging.
Let's say data shows that the majority of your audience members fall within the 35-44 age group, live in a household with three to four people, and work full time.
This likely indicates that a large portion of your audience is made up of working parents. So, you should tailor your messaging to address their needs and preferences.
4. Develop Hypotheses
Based on the insights you’ve gathered, identify one problem you want to solve and create a hypothesis to serve as the basis of your conversion rate optimization experiment.
Here’s what you need to create a hypothesis:
- Problem statement: “Users abandon the carts because the checkout page requires them to register first”
- Proposed solution: “Add a guest checkout option on the checkout page”
- Expected outcome: “This change will improve purchase conversions by 2%”
Based on the above information, the hypothesis would be:
“Offering a guest checkout option alongside the standard registration process during checkout will cart abandonmentand increase purchase conversions by 2%.”
Here are some broad ideas to consider for different pages:
- Homepage: Better communicate your value proposition and ensure easy navigation
- Landing pages: Keep landing pages relevant to users’ search intent or your ad campaign and minimize form fields
- Product or service pages: Emphasize benefits over features, use high-quality visuals, and display customer reviews to build trust and credibility
- Pricing page: Simplify the layout, clearly outline pricing tiers and features, and include trust signals like testimonials and guarantees
- CTA buttons: Ensure buttons stand out and test the text, color, size, and placement
- Blog pages: Add targeted CTAs (e.g., “Download this guide” or “Subscribe to our newsletter”) and optimize for lead capture by offering relevant free resources
5. Run an A/B Test
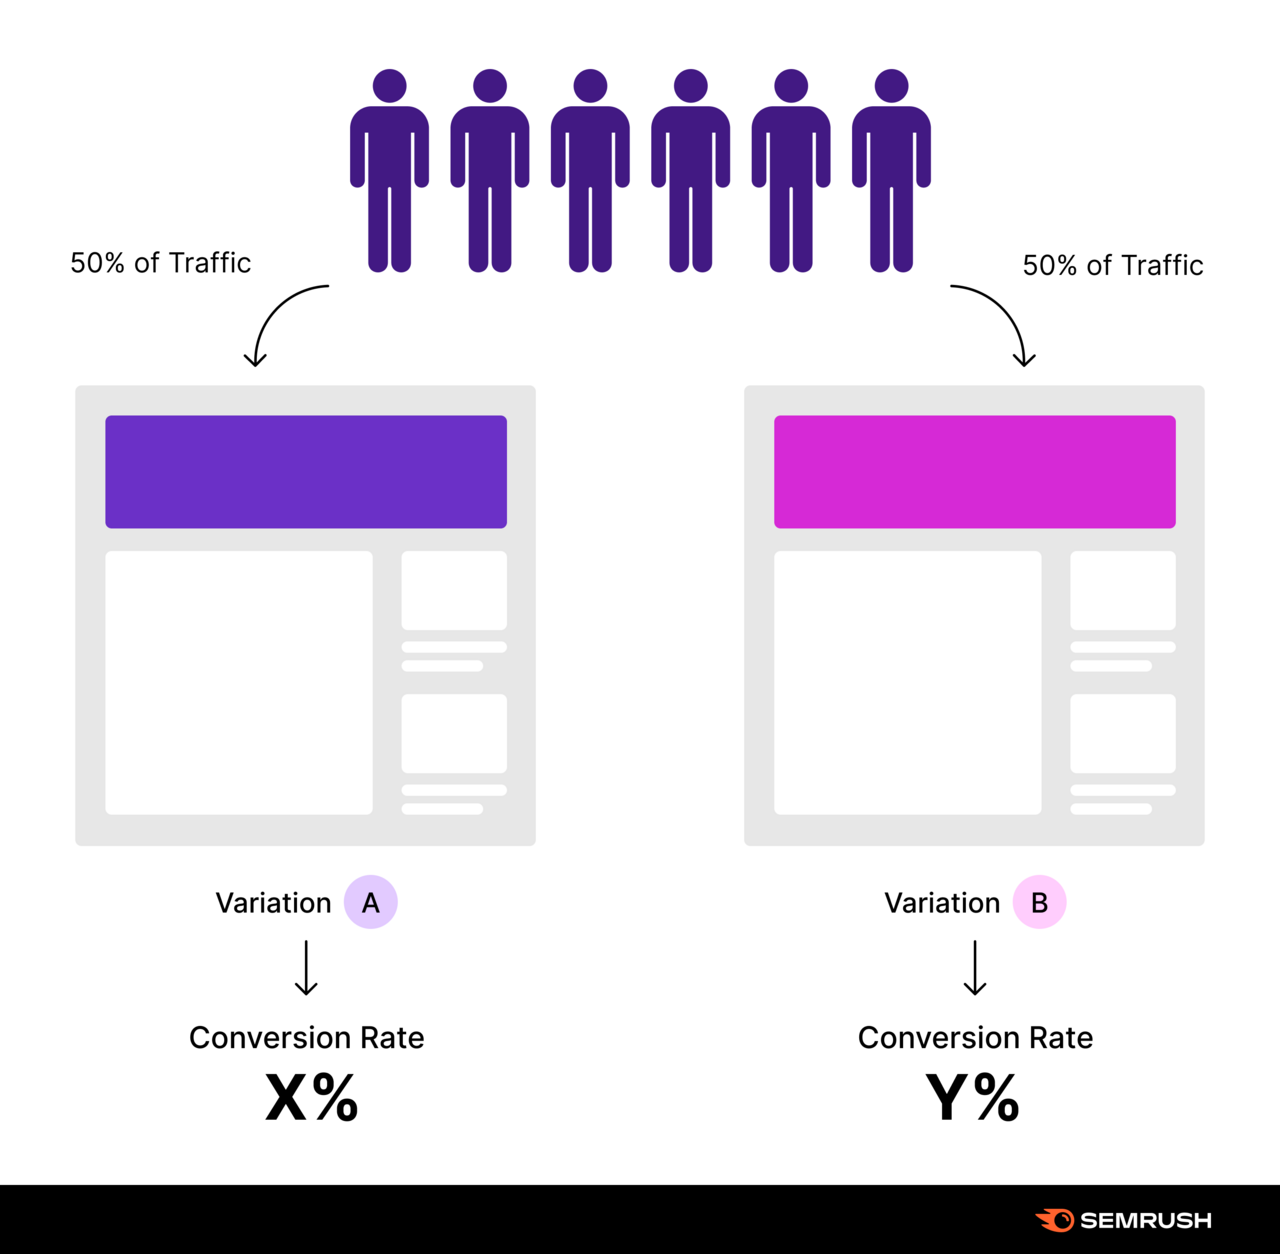
The next step is to perform an A/B test (also known as a split test), which lets you compare two variations of a page or element to see which performs better.
You should design a test page with two variations (A and B) to see the impact of your proposed solution.
Variation A (control) is the existing live page on site. And variation B (test) is the new page.
If we use the same example hypotheses from before, these will be:
- Variation A: The existing checkout process that requires users to register or log in to complete their purchase
- Variation B: A modified checkout process that includes an option to buy as a guest without registration
Push both pages live and implement a 302 redirect that randomly redirects users to each of the two versions (you may need to work with a developer for help).
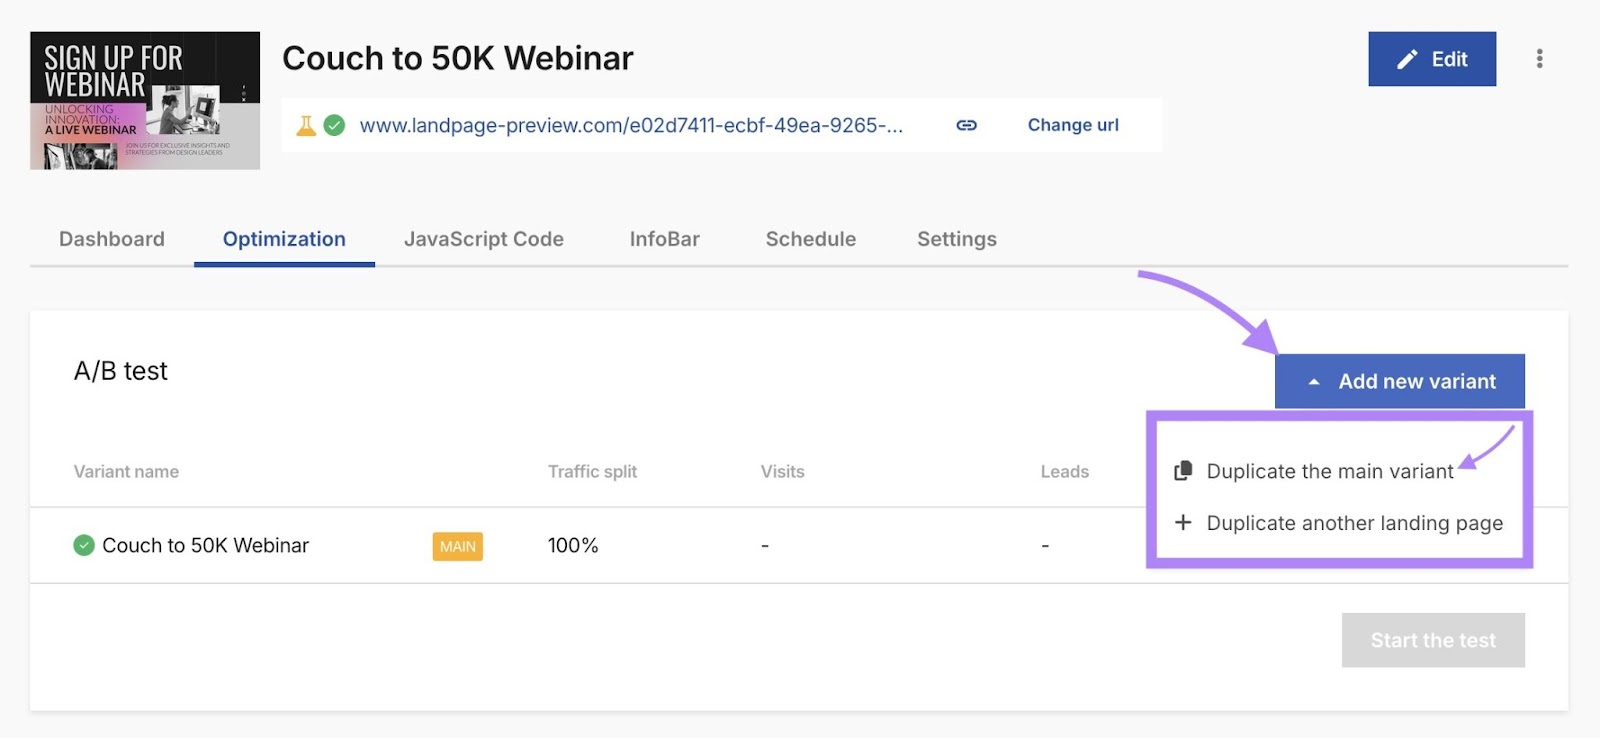
Alternatively, use a tool that takes care of the technical details for you. Like the Landing Page Builder app.
This tool makes it simple to set up a landing page and duplicate it to run A/B tests.
Run the experiment for a few weeks—depending on the size of your audience and expected traffic to that page.
For smaller sites with fewer visitors, you may need to extend the testing period to gather enough data for statistical significance.
If you have a high-traffic website, you may be able to collect sufficient data in a shorter time frame.
6. Track Results, Iterate, and Improve
Monitor your A/B test results to see how conversions are impacted.
If the results align with your hypothesis, you can consider your A/B test to be successful. And apply what you learned.
If the results don’t support your hypothesis, analyze other metrics to gain insight into what’s going on. And use these insights to refine your hypothesis for the next test.
Note that conversion optimization is an ongoing process. Which means you’ll want to continuously test.
It’s also a good idea to keep a record of your experiments and the results to inform future conversion rate optimization and marketing efforts
Get Started with CRO by Understanding Your Audience
Conversion rate optimization requires continuous iteration and improvement on your site to align it with your audience’s wants and needs.
Which means thorough audience research is the key to a successful CRO strategy.
Semrush’s One2Target tool provides information about your audience’s preferences, behaviors, and pain points to help you gain insights that you can apply to drive more conversions.
